
Figure 3.
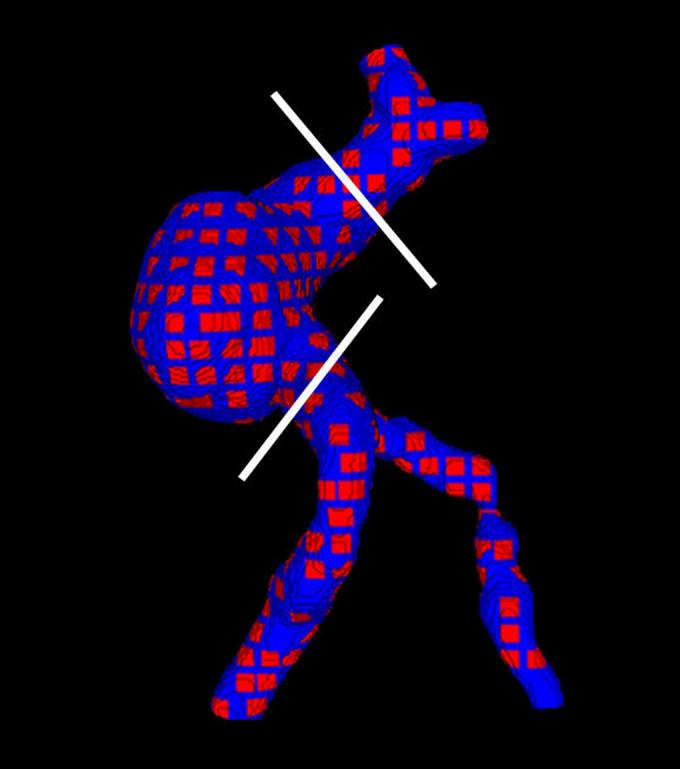
Sampling on the aneurysm: Patches are placed at regular intervals over the surface. White lines indicate the cut planes. Only the body of the aneurysm is taken into account in the statistical analysis.
Official websites use .gov
A
.gov website belongs to an official
government organization in the United States.
Secure .gov websites use HTTPS
A lock (
) or https:// means you've safely
connected to the .gov website. Share sensitive
information only on official, secure websites.
Sampling on the aneurysm: Patches are placed at regular intervals over the surface. White lines indicate the cut planes. Only the body of the aneurysm is taken into account in the statistical analysis.