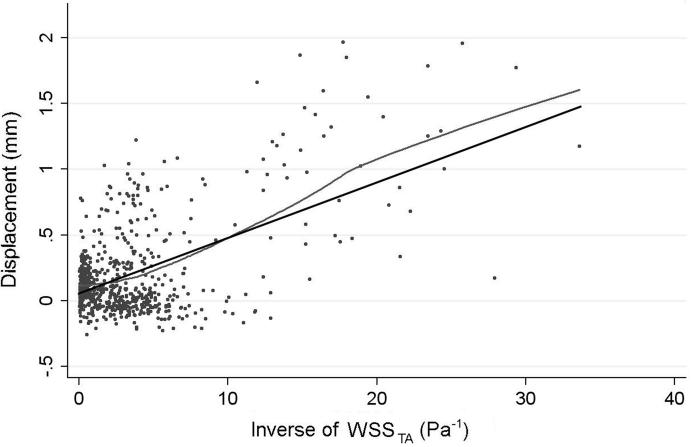
Figure 4.
Scatter Plot of the local displacement as a function of the inverse of time-averaged WSS (WSSTA) showing a clear trend for increased growth (high values of displacement) at patches that experience low WSS through the cardiac cycle (i.e. high values of inverse WSSTA). A linear regression (black) fit to the data (p<0.001). The LOWESS curve (grey) closely follows the linear regression curve, confirming that linear regression is reasonable both locally and globally and is not biased by outliers.

