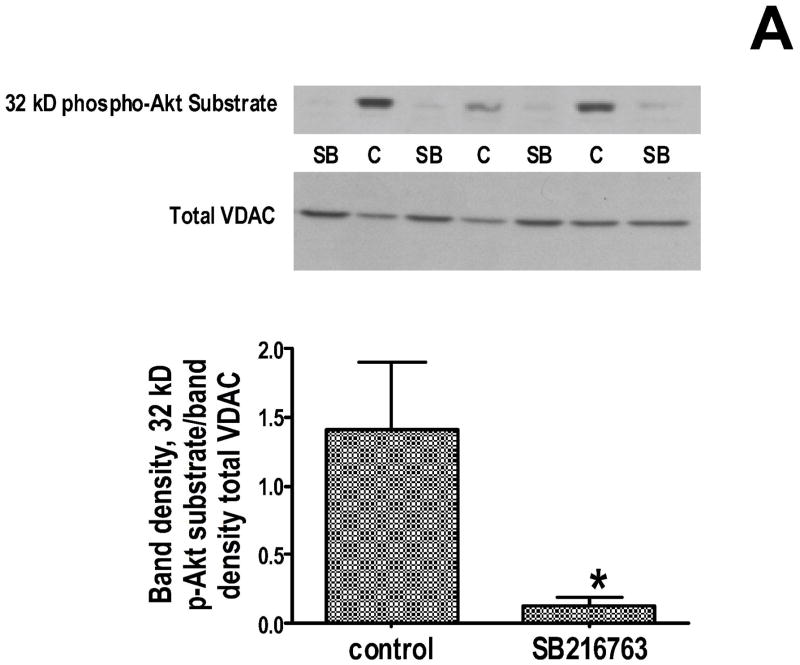
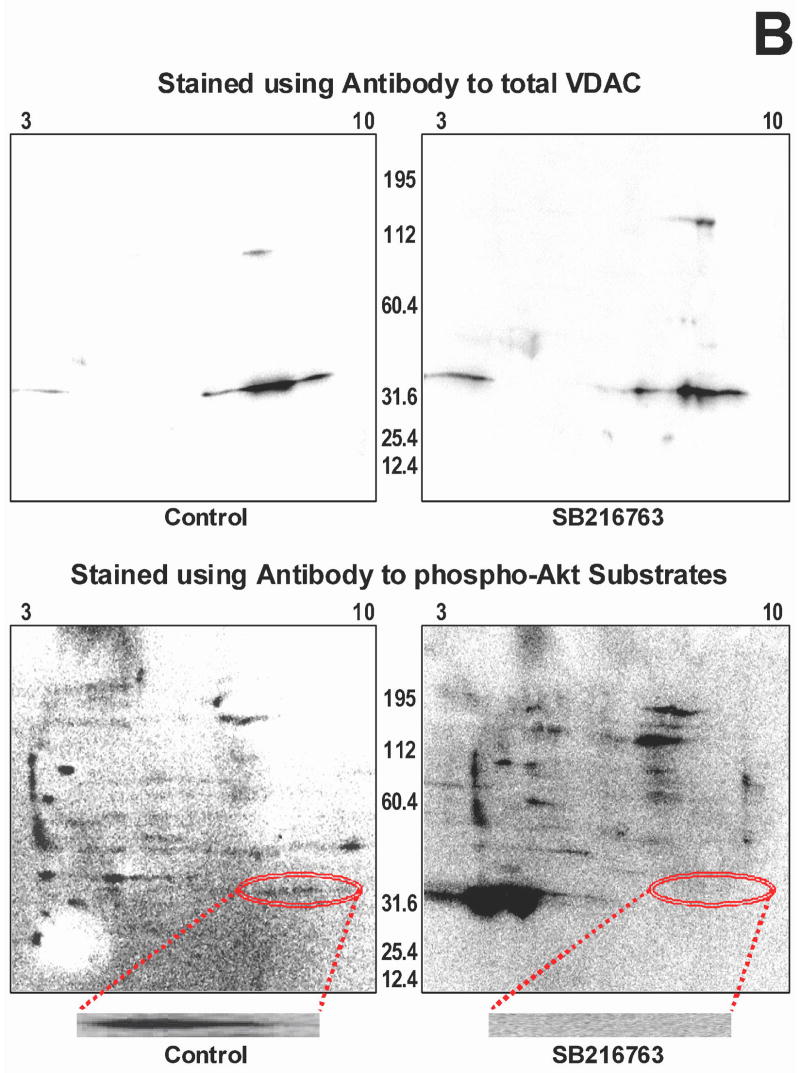
Figure 5.
Effect of GSK inhibition on phosphorylation of a 32 kD protein. Panel A-top is a representative 1D gel showing the amount of 32 kD phosphorylated Akt substrate protein in control and GSK inhibitor treated heart extracts. Panel A-middle shows the gel re-probed with VDAC antibody, showing no significant difference in total VDAC expression. Gel densitometry was performed for quantitation, and the ratio of 32 kD phospho-protein to total VDAC is plotted. *p<0.05 vs control. In Panel B, whole heart homogenates were further separated using 2D gel electrophoresis. In the upper panels, control homogenate (left) and GSK inhibitor treated homogenate (right) is probed with VDAC antibody. Then the membranes were stripped and reprobed for phosphorylated Akt substate protein (lower images). There is phosphorylated protein in the VDAC region in control but not in GSK inhibitor treated homogenate. The region of interest is circled and shown at higher magnification at the bottom.


