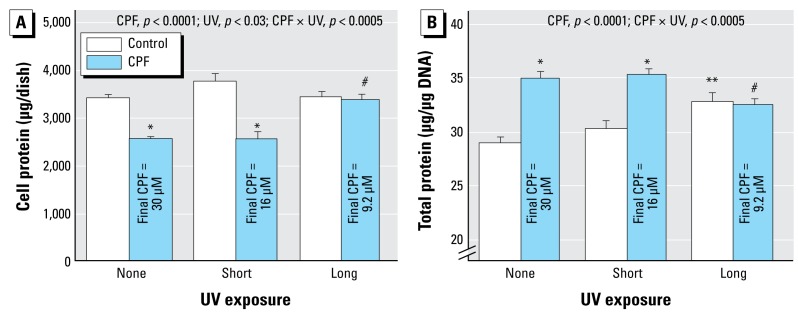
Figure 4.
Effects of CPF and CPF photolysis products on total cell protein (A) and protein:DNA ratio (B) in differentiating PC12 cells treated with the indicated agents along with NGF for a total of 6 days (47 mM methanol; n = 8). ANOVA p-values across all treatments and UV exposures appear within the panel.
Lower-order tests, p < 0.05 for *CPF compared with control; **UV-exposed control compared with control/none; and #UV-exposed CPF compared with CPF.

