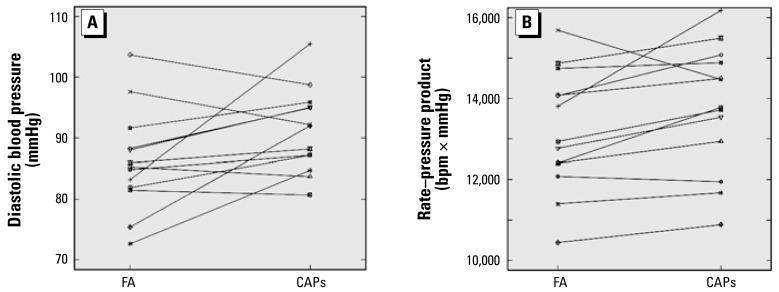
Figure 1.
Average diastolic blood pressure (A) or rate–pressure product (B) by dog during exposure to either FA or CAPs. Each point represents the crude mean response across all FA or CAPs exposures for a single dog. Responses from the same dog are connected by a solid line. Table 1 shows the numbers of exposures for each dog.

