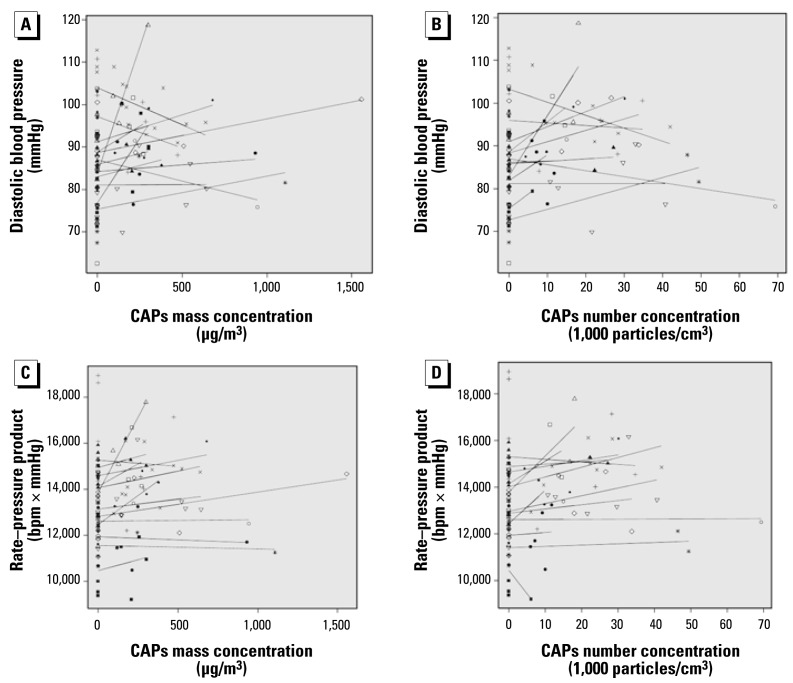
Figure 3.
Estimated dose–response relationships by dog for diastolic blood pressure (A and B) and rate–pressure product (C and D). Each point represents the average of all measurements across a single 5-hr exposure period in a single dog. Each symbol represents data from a different dog, and each solid line represents the dog-specific slope and intercept from a linear model relating the given exposure metric to the given outcome.

