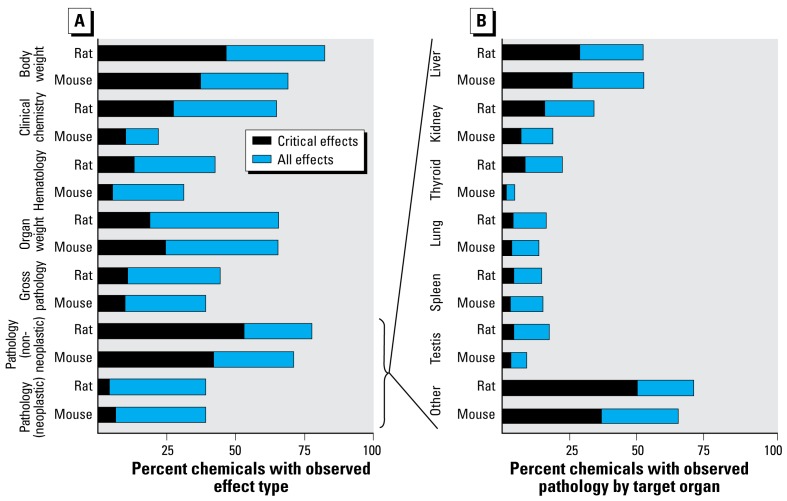
Figure 2.
ToxRefDB chronic/cancer incidence data summarized by effect type (A) and by target organ pathology (B) for 310 chemicals with rat or mouse studies. Blue bars, total percentage of chemicals with that observed effect; black bars, percentage of chemicals for which that effect was used to derive systemic NOAEL/LOAEL levels.

