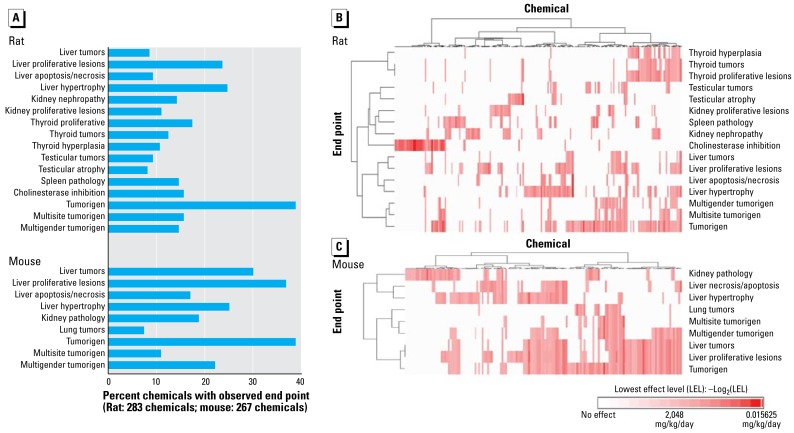
Figure 4.
(A) The 16 rat and 9 mouse ToxRefDB end points from chronic/cancer studies selected for ToxCast predictive modeling. Two-way hierarchical clustering of the rat (B) and mouse (C) end points based on log-transformed potency values. Dose and potency values for all chemicals relative to these 25 end points are provided on the ToxRefDB home page (U.S. EPA 2008c).

