
Figure 2.
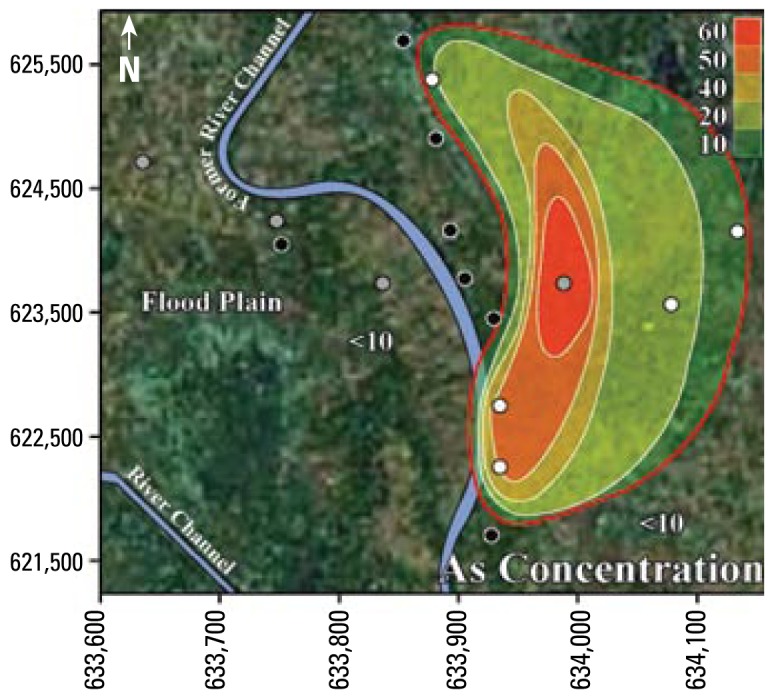
Contour map showing As concentrations (μg/L) in tube well water from Jamjami. White circles are shallow tube wells [18–27 m below ground surface (bgs)], gray circles are intermediate tube wells (28–37 m bgs), and black circles are deep tube wells (38–55 m bgs). The red contour line represents the area with wells that exceed the 10 μg/L WHO health-based drinking water guideline.