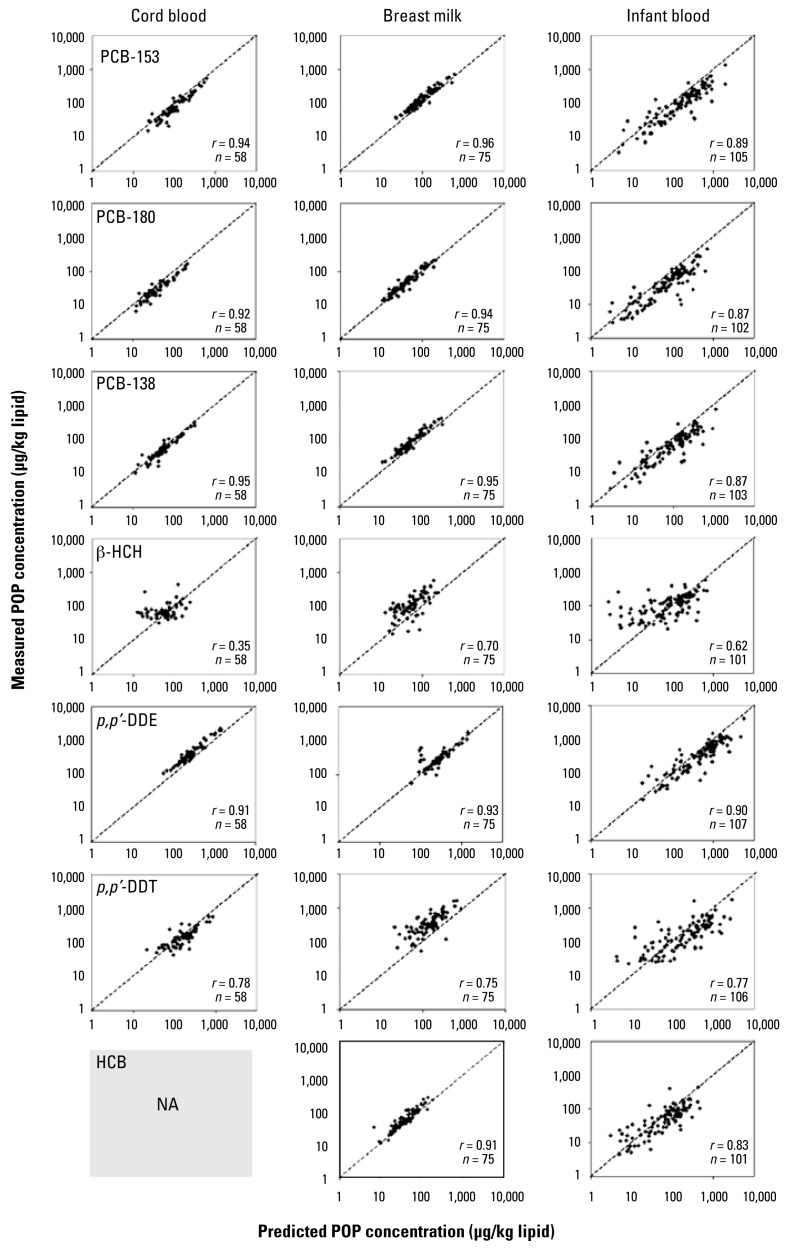
Figure 3.
Spearman’s correlations between predicted and measured lipid adjusted POP levels in infant plasma, cord blood, and breast milk. NA, not applicable. Dotted lines represent the unity slope. Correlation analysis for HCB levels in cord blood could not be conducted because this compound was not measured in this media.

