
Figure 5.
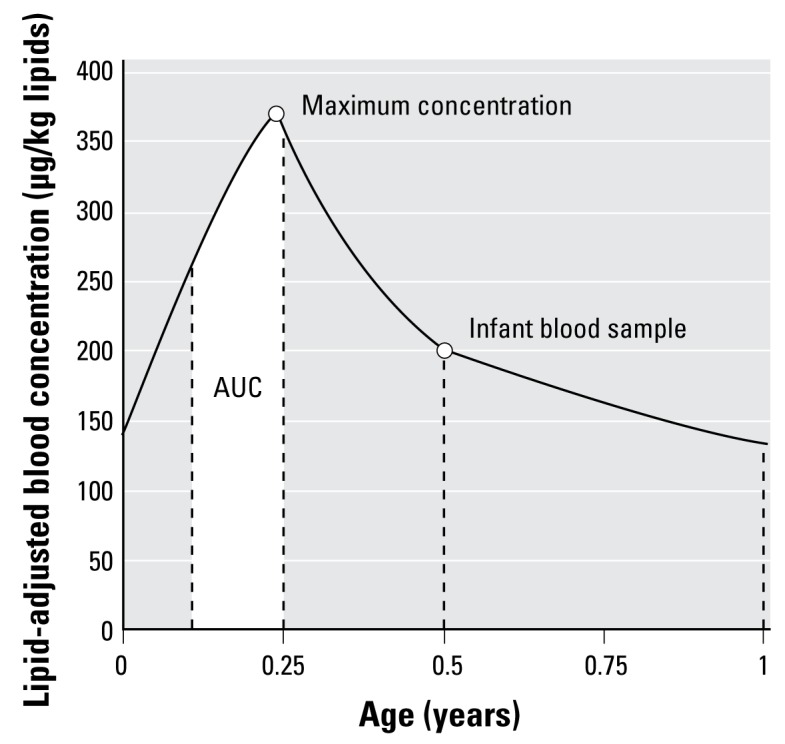
Graphic representation of information to be harvested from simulations. The maximum concentration and the area under the curve (AUC) represented by the white area are examples of information to be extracted from the toxicokinetic curve.
Official websites use .gov
A
.gov website belongs to an official
government organization in the United States.
Secure .gov websites use HTTPS
A lock (
) or https:// means you've safely
connected to the .gov website. Share sensitive
information only on official, secure websites.
Graphic representation of information to be harvested from simulations. The maximum concentration and the area under the curve (AUC) represented by the white area are examples of information to be extracted from the toxicokinetic curve.