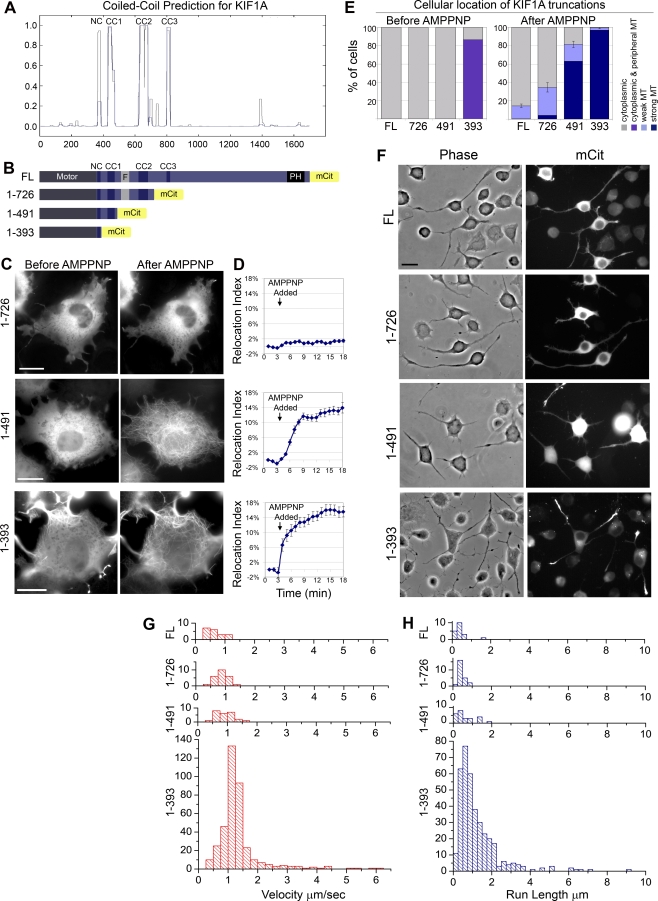
Figure 2. Truncation of the FHA+CC2 Region Relieves Autoinhibition of Microtubule Binding but Not Processive Motility.
(A) CC prediction for MmKIF1A using windows of 14 (gray line) or 21 (blue line) amino acids (COILS, Lupas Method).
(B) Schematic of mCit-tagged FL and truncated KIF1A constructs.
(C–E) Live-cell microtubule binding assay. COS cells expressing mCit-tagged KIF1A truncations were imaged during SLO permeabilization and AMPPNP treatment. (C) Still images. Scale bar indicates 20 μm. (D) Quantification of the percentage of KIF1A-mCit that changed from cytoplasmic to microtubule (MT)-associated localization (Relocation Index) over time. (1–726), n = 17 cells; (1–491), n = 11 cells; (1–393), n = 12 cells. (E) Percentage of cells whose KIF1A truncations localize to the indicated cellular locations before and after AMPPNP treatment. (Average = three to five experiments, 50–100 cells each).
(F) Processive motility in vivo. Representative images of differentiated CAD cells expressing mCit-tagged constructs. Scale bar indicates 20 μm.
(G and H) Processive motility in vitro. Single-molecule motility assays were carried out using COS cell lysates expressing 3xmCit-tagged constructs. Individual spots were tracked, and population velocities (G) and run lengths (H) were plotted as histograms.

