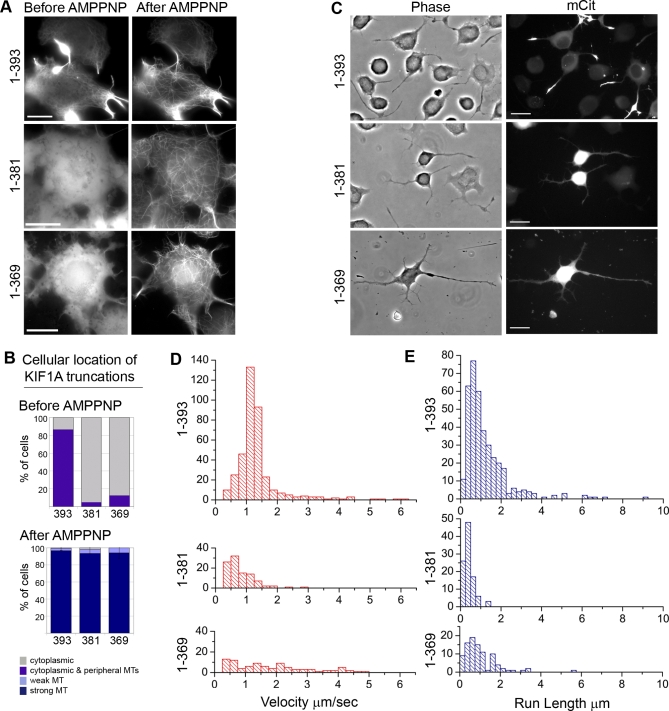
Figure 5. Motor Properties of Monomeric and Dimeric KIF1A Motors.
(A and B) Live-cell microtubule binding assay. COS cells expressing mCit-tagged NC constructs were imaged during SLO permeabilization and AMPPNP treatment. (A) Representative images before and after AMPPNP treatment. Scale bar indicates 20 μm. (B) Percentage of cells whose NC constructs localize to the indicated cellular locations before and after AMPPNP treatment (averages of two to three experiments, ∼50 cells each). MT, microtubule.
(C) In vivo processive motility assays of mCit-tagged NC constructs in differentiated CAD cells. Scale bar indicates 20 μm.
(D and E) In vitro single-molecule motility assays of COS cell lysates expressing 3xmCit-tagged NC constructs. (D) Distribution of velocities. (E) Distribution of run lengths.

