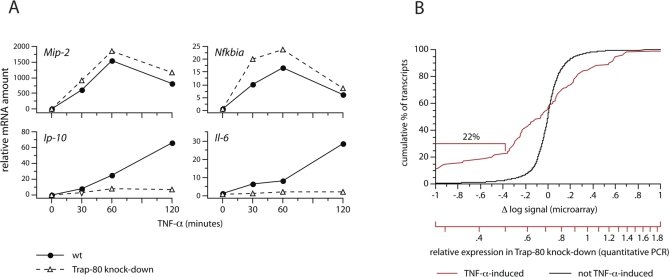
Figure 2. Trap-80–Dependent and –Independent Genes.
(A) Expression of Mip-2, Nfkbia, Ip-10, and Il-6 mRNA in subconfluent cultures of wild-type and Trap-80 knock-down fibroblasts, after stimulation with TNF-α. mRNA levels are expressed relative to unstimulated, wild-type cells; the results presented here are representative of more than ten experiments.
(B) Trap-80–dependence of TNF-α–induced versus noninduced genes. Cumulative percentage of transcripts whose expression in Trap-80 knock-down cells exceeds the indicated level in wild-type cells, expressed both as the Δ log signal of the microarray probes (upper scale) and the calculated relative expression level using a standard curve generated by quantitative PCR of a subset of 36 genes (lower scale). The red line represents the top 100 TNF-α–induced transcripts; the black line represents 5,000 transcripts whose levels were unchanged by TNF-α stimulation. Table S1 lists the top 50 Trap-80–dependent and –independent TNF-α–induced genes.

