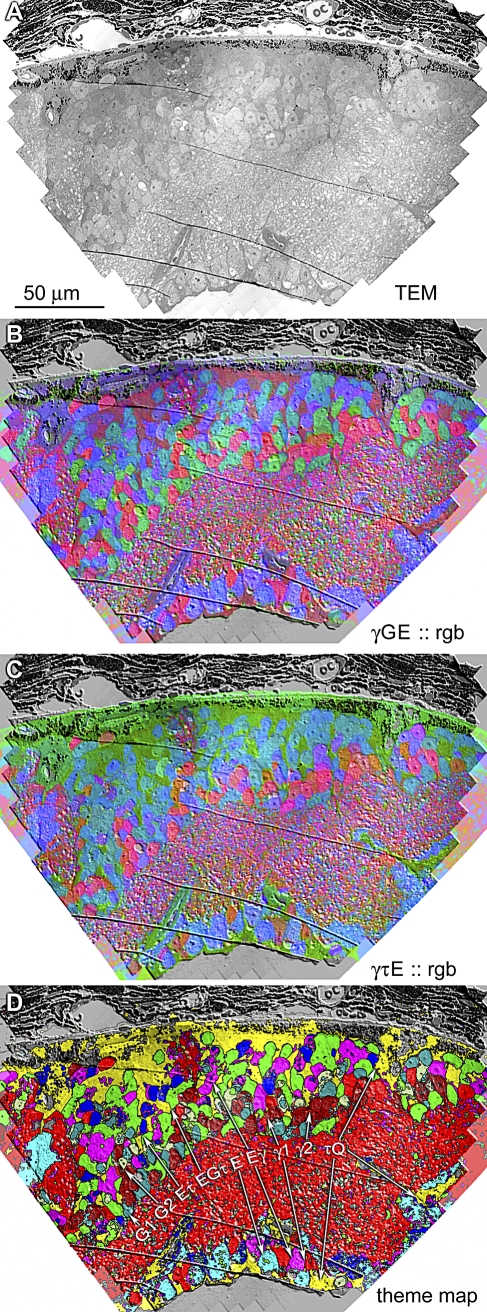
Figure 12. Fusion of ssLM CMP and ssTEM Data.
The mouse retinal microneuroma data shown in previous figures are comprised of the initial section in the ssTEM set (A), a set of four bounding 90-nm ssLM sections visualized by IgG γ, IgG G, IgG E, and IgG τ, all registered by ir-tweak, mapped as γGE :: rgb (B) and γτE :: rgb (C) triplets, converted by cluster analysis in CMPView into a classified theme map of nine discrete superclasses (see text).

