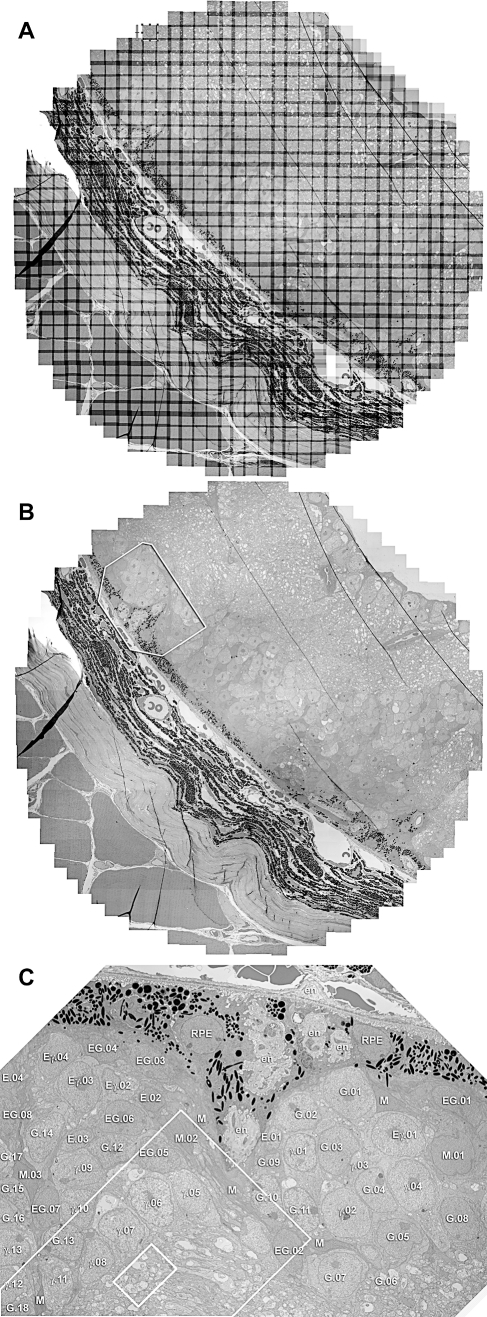
Figure 14. Browsing 30-GB Datasets with MosaicBuilder .
For this image, 1,001 TEM images were captured at 5,000× (2.18 nm/pixel) with SerialEM, tiled into a single mosaic dataset by ir-translate and ir-grid-refine, and visualized with MosaicBuilder. The overlap of each image with its neighbors is shown in (A) and the entire seamless image visualized in (B). The polygonal region in (B) is visualized in (C) simply by “zooming” in MosaicBuilder and the classifications obtained in Figure 11 annotated onto the initial section of the dataset. The rectangles in (C) are further enlargements that extend to the synaptic level. See Video S3.

