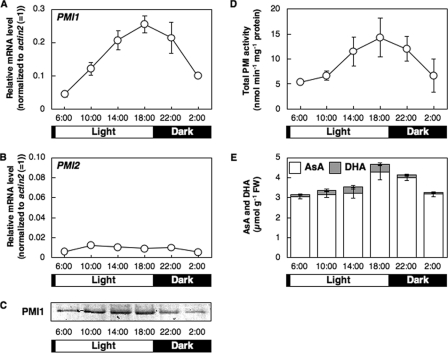
FIGURE 7.
PMI1 and PMI2 expression, total PMI activity, and AsA concentrations in A. thaliana leaves in relation to the time of day. The leaves of 3-week-old Arabidopsis plants were harvested at the indicated times through a 24-h light/dark cycle. Relative levels of PMI1 (A) and PMI2 (B) were determined by real time PCR as described in Fig. 4. Error bars indicate S.D. (n = 3). C, Western blot of PMI1 protein. D, total PMI activity in crude extracts of Arabidopsis leaves. Error bars indicate S.D. (n = 3). E, AsA and DHA concentrations in Arabidopsis leaves. Error bars indicate S.D. (n = 3).

