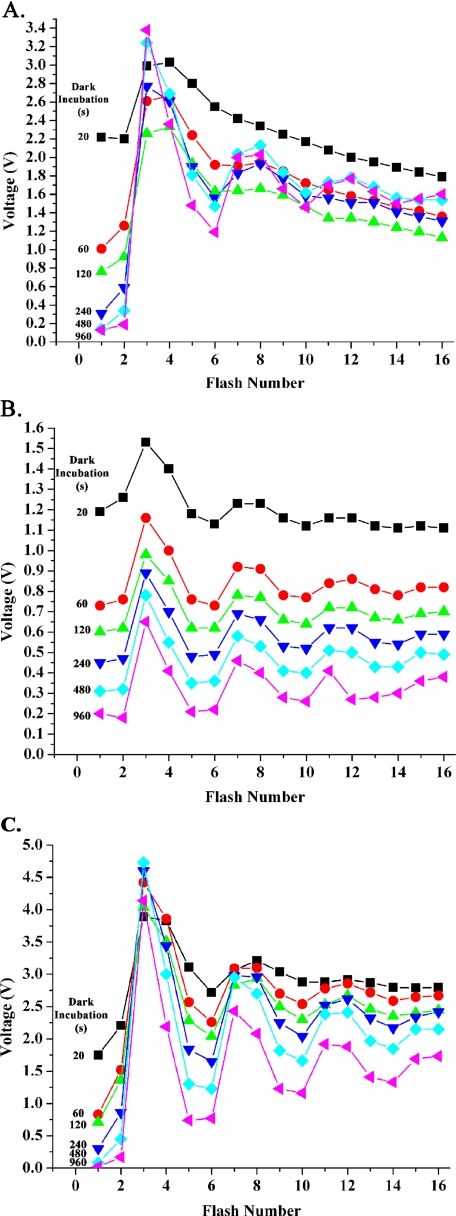
FIGURE 1.
Raw data illustrating typical flash oxygen yield curves obtained from the wild type (A), the psbo1 mutant (B), and the psbo1 mutant + 20 mm CaCl2 + 50 μm ionomycin (C). A single sample was used to collect the data in each graph. The length of dark incubation between each flash series is shown. In A and B, the samples contained 10 mm chloride with no added calcium. In C, the sample contained 20 mm CaCl2 + 50 μm ionomycin. The dark incubation time for each 16-flash series is color-coded as follows: 20 s, black squares; 60s, red circles; 120 s, green triangles; 240 s, blue triangles; 480 s, aqua diamonds; and 960 s, magenta triangles. Please note that the flash experiments shown in B are not offset. The addition of 20 mm CaCl2 + 50 μm ionomycin to wild type thylakoids had no apparent effect on the flash oxygen yield pattern and is not shown.

