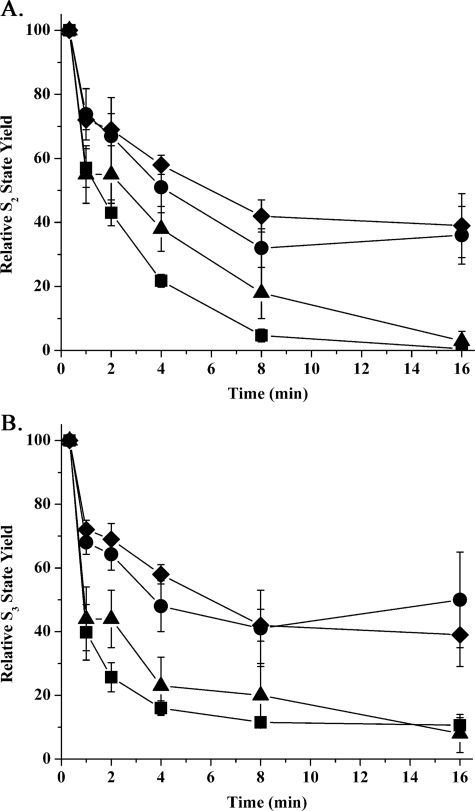
FIGURE 2.
S2 (A) and S3 (B) state lifetime decay curves for wild type Arabidopsis and psbo1 mutant thylakoids under different ionic conditions. The time axis indicates time of dark incubation at 24 °C. ▪, wild type decay curve under control ionic conditions (10 mm chloride with no added calcium); •, psbo1 control; ♦, psbo1 + 150 mm NaCl; ▴, psbo1 + 20 mm CaCl2 + 50 μm ionomycin (n = 4–13; error bars are ±1 S.E.). In some instances, the symbols are larger than the error bars. Treatment of wild type thylakoids with either 150 mm NaCl or 20 mm CaCl2 + 50 μm ionomycin had little effect on the S state lifetimes or other parameters examined in this study and are not shown.

