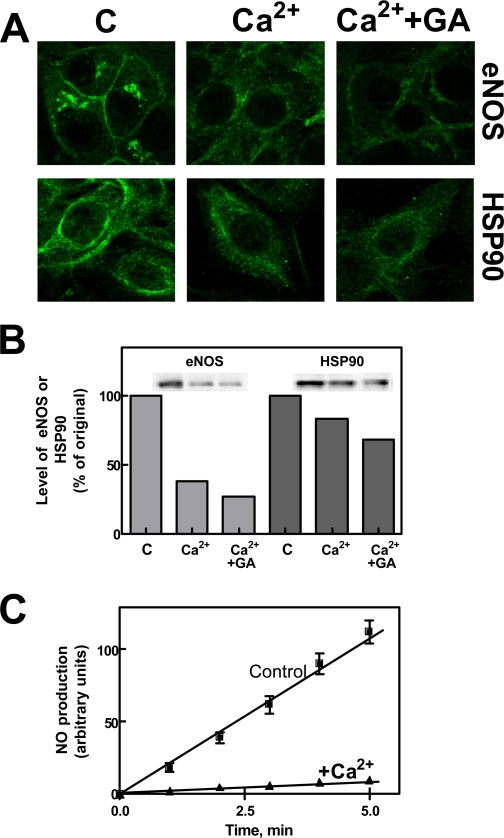
FIGURE 6.
Effect of a prolonged increase in intracellular free calcium on eNOS and HSP90 protein levels. A, bEnd5 cells grown on glass slides (8 × 10⁴ cells) were left untreated (C), or were treated with 1 μm Ca2+-ionophore A23187 for 30 min in the absence (Ca2+) or in the presence of 100 nm geldanamycin (Ca2+ + GA). Geldanamycin was added 30 min before the specific stimulus. After treatment, eNOS and HSP90 localization was determined by confocal microscopy using the specific antibodies as described under “Experimental Procedures.” B, bEnd5 cells (1 × 10⁵) submitted to the same experiments carried out in A, were lysed in SDS-PAGE loading solution (100 μl) under the same conditions reported in the legend to Fig. 1E. Aliquots of each sample (30 μl) were used for Western blot analysis, and the immunoreactive bands were quantified as described under “Experimental Procedures.” C, bEnd5 cells (2 × 10⁴) were loaded for 30 min at 37 °C with DAF-2 DA as described under “Experimental Procedures” and then incubated in the absence (Control) or presence of 1 μm Ca2+-ionophore A23187 (+Ca2+) for 30 min. After treatment, eNOS activity was assessed as the l-NAME-dependent increase in fluorescence at the indicated times of incubation.

