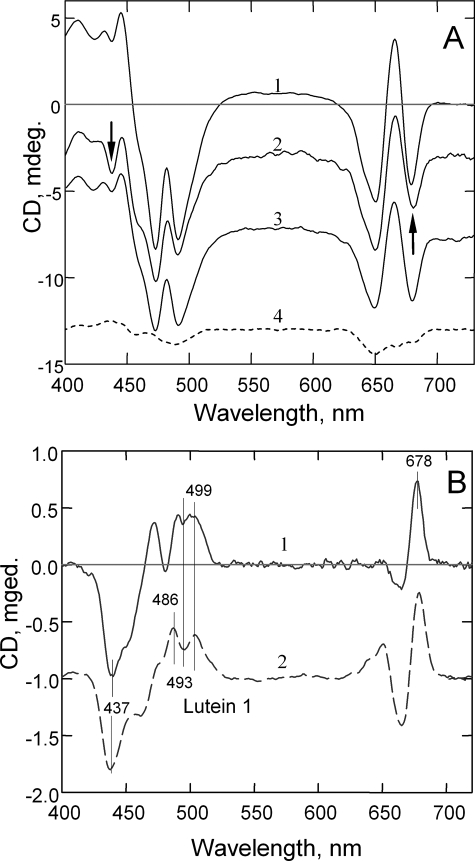
FIGURE 5.
A, CD spectroscopy of LHCII incorporated into gel. Shown are room temperature CD spectra of unquenched (trace 1), quenched (trace 2), recovered (trace 3), and partially unfolded (70 °C, 5 min) (trace 4) trimers. The arrows indicate the most affected regions in the spectrum of the quenched sample. B, difference CD spectra for quenched-minus-recovered LHCII in the gel (trace 1) and aggregated-minus-trimeric LHCII (trace 2). mdeg., millidegrees.

