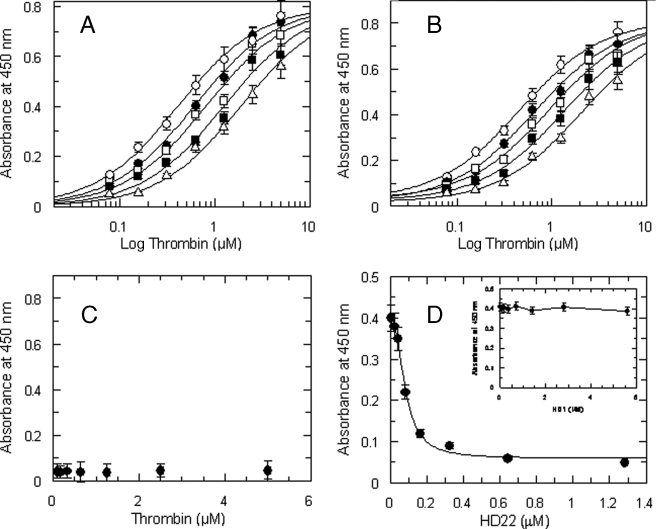
FIGURE 2.
A, binding of thrombin to immobilized fragment D* in the presence of varying concentrations of purified γ′ peptide used at the following concentrations (○) 0, (•) 22.5 μm, (□) 45 μm, (▪) 90 μm, and 180 μm (Δ). The solid lines were drawn according to the best fit parameter values of a simultaneous fit to single site binding isotherm and a competitive inhibition scheme: Kd of thrombin binding to fragment D* = 0.41 ± 0.04 μm, and Ki of the γ′ peptide = 47.5 ± 6 μm. B, effect of the 45–57 C-terminal hemadin peptide on thrombin-fragment D* interaction. The solid lines were drawn according to the best fit parameter values of a single site binding isotherm and a competitive inhibition scheme: Kd of thrombin binding = 0.4 ± 0.03 μm, and Ki of the C-terminal hemadin peptide = 4.2 ± 0.4 μm. The concentrations of the hemadin peptide were (○) 0, (•) 2 μm, (□) 4 μm, (▪) 8 μm, and 16 μm (Δ). The experimental data set was analyzed by simultaneous fitting. C, control experiments showing the absence of interaction between thrombin and immobilized fragment D. D, binding of 500 nm thrombin to immobilized fibrinogen fragment D* as a function of the aptamer HD22 concentration. The solid line was drawn according to the best fit IC50 value equal to 81 ± 6 nm. In the inset, a similar experiment, carried out as a function of the aptamer HD1 concentration, is shown.

