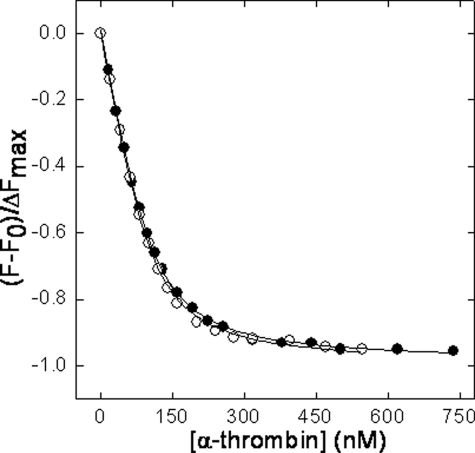
FIGURE 8.
Plot of the normalized fluorescence fractional change (F - F0/ΔFmax) of [F]-hirudin54–65(PO3H2) (110 nm) as a function of human α-thrombin concentration in the absence (•) or in the presence (○) of 74 μm of γ′ peptide. The solid lines were drawn according to Equation 3, with best fit parameters Kd = 19.7 ± 1.2 nm (•) and 14.3 ± 1.5 nm (○).

