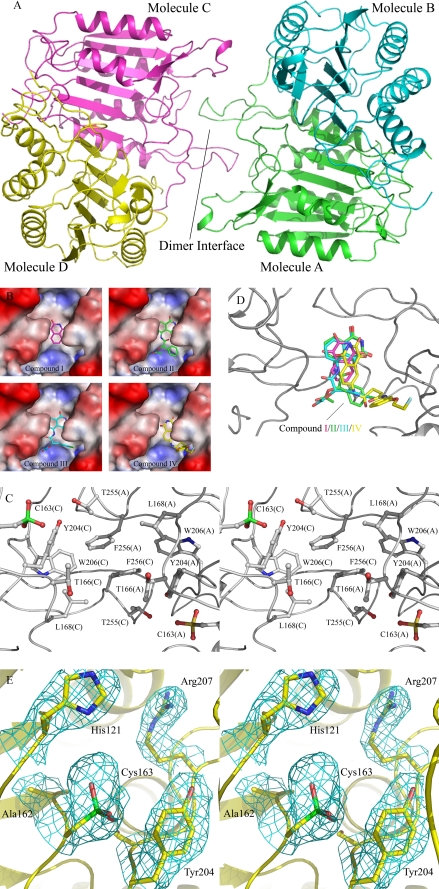
FIGURE 6.
Crystal structures of caspase-3 in complexes with inhibitors. A, a ribbon diagram shows the overall structure of caspase-3. B, molecular surface maps represent the hydrophobic pocket with the bound inhibitors. C, a stereo view shows the composition of the hydrophobic pocket at the dimer interface and the oxidation of the catalytic cysteine (Cys163) to sulfonic acid. D, the four inhibitors are superimposed at the binding site within bound compounds I, II, III, and IV colored in magenta, green, cyan, and yellow, respectively. E, a stereo view shows the catalytic active site of molecule C. The 2Fo - Fc sa_omit_map (1σ contour level) for the oxidized catalytic cysteine and the residues nearby are shown with cyan meshes.

