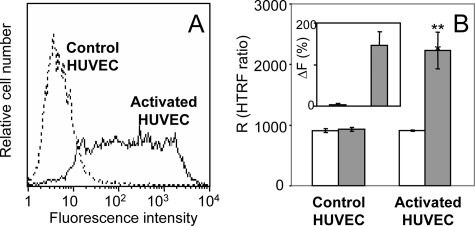
FIGURE 3.
HTRF measurements of CX3CL1 in HUVEC. A, resting HUVEC (dotted line) and activated HUVEC (continuous line) were stained with phycoerythrin murine mAb anti-CX3CL1 and analyzed by flow cytometry. B, resting HUVEC (left) and activated HUVEC (right) were stained with anti-CX3CL1 mAb labeled with cryptate (donor) and with D2-labeled anti-CX3CL1 mAb (acceptor) (filled bars) as described under “Experimental Procedures.” Control measurements were made with anti-FLAG D2-labeled mAb as acceptor (empty bars). The FRET signals were plotted as HTRF ratio R (r = (fluorescence at 665 nm/fluorescence at 620 nm) × 104). The HTRF difference between HUVEC and activated HUVEC was significant (**, p < 0.0018). Insert, the specific signal over background called ΔF was calculated with the following formula: ΔF = (Rpos - Rneg)/Rneg where Rpos corresponds to the HTRF ratio with anti-CX3CL1 mAb as acceptor and Rneg to the ratio with anti-FLAG mAb as acceptor.

