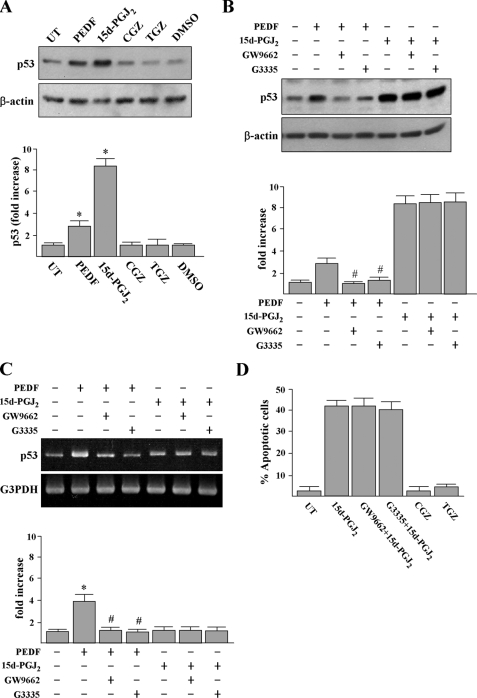
FIGURE 5.
PPARγ agonist and antagonist effects on p53 expression and apoptosis in HUVECs. A, cells were treated with 200 ng/ml PEDF or 10 μm PPARγ agonists (15d-PGJ2, CGZ, and TGZ) or DMSO solvent for 12 h, and p53 protein was detected by Western blot analysis. *, p < 0.05 versus untreated (UT) cells. B and C, HUVECs were pretreated with 10 μm PPARγ antagonists (GW9662 and G3335) for 1 h prior to incubation with PEDF or 15d-PGJ2 for an additional 10 h. Cellular proteins and total RNA were then extracted for Western blot analysis and RT-PCR analysis. Representative blots (top panels) and densitometric analysis with S.D. (bottom figure) are shown. *, p < 0.05 versus untreated cells. #, p < 0.001 versus PEDF-treated cells. D, apoptosis was quantified by using the annexin V-FITC apoptosis detection kit.

