FIGURE 4.
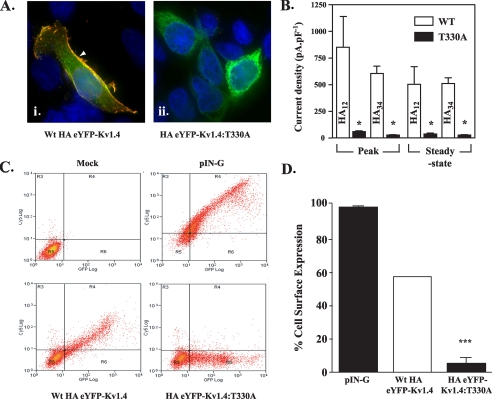
Surface levels of HA-tagged eYFP-Kv1.4:T330A are reduced compared with HA-tagged WT eYFP-Kv1.4. A, imaging reveals surface localization (arrowheads) of WT HA12-eYFP-Kv1.4 (i) and ER localization of HA12-eYFP-Kv1.4:T330A (ii). Live, transiently transfected HEK293 cells were labeled, at 48 h post-transfection with anti-HA antibody to detect surface channels prior to fixation and detection with a Cy3-conjugated secondary antibody. Green, eYFP fluorescence; red, Cy3 secondary antibody; blue, DAPI (nuclei) stain. Scale bar corresponds to 15 μm. B, patch clamp recordings show reduction in surface expression of HA-eYFP-Kv1.4:T330A versus WT HA-eYFP-Kv1.4 channels, which is independent of the location of the HA tag. Whole-cell currents were evoked in cells transfected with WT HA-eYFP-Kv1.4 or eYFP-Kv1.4:T330A mutants bearing the HA epitope tag in either the S1-S2 (HA12-eYFP-Kv1.4:T330A) or S3-S4 (HA34-eYFP-Kv1.4:T330A) linkers. Cells were held at a potential of -80 mV and currents measured in response to 20-mV voltage steps between -60 and +60 mV. Mean ± S.E. data of peak and steady-state currents (measured at the end of the voltage step) at +60 mV normalized to cell capacitance. Asterisks, p < 0.05, Tukey. C, quantitation of surface expression through FACS. Following surface labeling with anti-HA (primary) and Cy5 (secondary) antibody, mock-transfected control HEK293 cells (upper left panel) show low background fluorescence (log scale) in red (Cy5, surface; ordinate) and green (eYFP; abscissa) channels (defined as background, quadrant R5). Transfection with an HA- and GFP-tagged membrane marker (pIN-G) (23) (positive control; upper right panel), WT HA34-eYFP-Kv1.4 (lower left panel), or HA34-eYFP-Kv1.4:T330A (lower right panel) revealed a cell population displaying fluorescence in red and green channels (quadrant R4). Note size of population in quadrant R6 (low red (surface) fluorescence) for cells transfected with HA-eYFP-Kv1.4:T330A. D, comparison of HA34-eYFP-Kv1.4: T330A and WT HA34-eYFP-Kv1.4 surface expression determined by FACS. Data were determined from the ratio of surface to total population fluorescence (i.e. R4/(R4 + R6)) and normalized to the WT HA34-tagged channel (100%). A significant difference (n > 3, p < 0.05; Student-Newman-Keuls test) was observed between the WT and T330A mutants.

