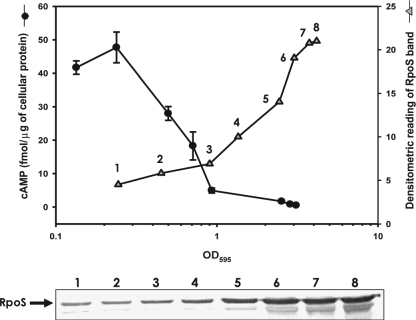
FIGURE 3.
Intracellular levels of cAMP and RpoS at various growth stages of V. vulnificus. V. vulnificus cells grown in LBS were assayed for cAMP using the cAMP Biotrak enzyme immunoassay system (Amersham Biosciences), and presented as femtomoles of cAMP per μg of bacterial protein (circles). At various time points of bacterial growth (designated by numbers from 1 to 8), cells were harvested and then subjected to Western blot analysis (lower panel). The intensities of bands corresponding to RpoS were estimated by densitometry and are also presented in the plot (triangles).

