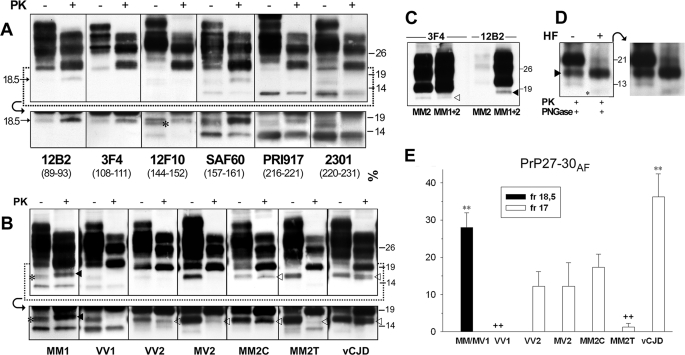
FIGURE 1.
Detection and characterization of a novel PrPSc truncated fragment in CJD. A, WB profiles of PrPSc from sCJDMM1: comparison among seven antibodies. A sample from the frontal cortex was treated (+) or untreated (–) with PK and probed with antibodies recognizing different epitopes (as indicated). The lower panels show the results obtained in the 12–20-kDa range at a longer film exposure. The C1 fragment (44), which is detected by all antibodies except 12B2 and 3F4 in all PK-untreated samples, is marked with an asterisk in the 12F10 lower panel. The 12B2 and 3F4 panels, due to the absence of the C1 fragment, better show the 18.5-kDa fragment in both PK-treated and PK-untreated conditions. B, WB profiles of PrPSc from different CJD subtypes as revealed by SAF60. Frontal cortex homogenates from all sCJD subtypes and vCJD were treated (+) or untreated (–) with PK and probed with SAF60. The lower panels show the results obtained in the 12–20-kDa range at a longer film exposure. The 18.5- and 17-kDa fragments are marked with filled and empty arrowheads, respectively. The C1 fragment (44), visible in all PK-untreated samples, is marked with an asterisk in the MM1 panel. C, WB profiles of PrPSc from MM2C and MM1+MM2C: comparison between 3F4 and 12B2. Frontal cortex homogenates from MM2C and MM1+MM2C were digested by PK and probed either with 3F4 or with 12B2. In MM2C, the 12B2 antibody shows only very weak bands migrating at the lower edge of the type 1 band, representing partially cleaved fragments generated by an incomplete PK digestion of PrPSc type 2 (37). The 18.5- and 17-kDa fragments are marked with filled and empty arrowheads, respectively. D, the effect of aqueous hydrofluoric acid (HF) treatment on the 18.5-kDa fragment. Immunoblot analyses of a frontal cortex homogenate from sCJDMM1 are shown. A PK- and PNGase F-digested sample was untreated or treated with aqueous hydrofluoric acid. The 18.5-kDa fragment and a weak band migrating with an apparent molecular mass of about 10 kDa, which likely represents the PrP CTF12–13 after the GPI loss, are marked with a filled arrowhead and an asterisk, respectively. The panel on the right shows the result obtained at a longer film exposure. The results shown in panels A–D were reproduced twice with samples from at least three subjects. Approximate molecular masses in panels A–D are in kilodaltons. E, quantification of 18.5- and 17-kDa fragments (fr) in the CJD subtypes. Quantification was performed by densitometric analyses of chemiluminescence Western blot signals generated by PNGase F-treated samples probed with SAF60. The amount is expressed as the percentage of PrP27–30. Each bar represents the mean ± S.E. Statistical analysis was performed by one-way analysis of variance followed by Fisher least squares difference comparison test. **, p < 0.001 versus each different group but MM1/MV1 or vCJD, p < 0.05 versus MM2C; ++, p < 0.001 versus MM1/MV1 and vCJD, p < 0.05 versus VV2, MV2, and MM2C. The number of cases analyzed for each group is reported under “Experimental Procedures.”

