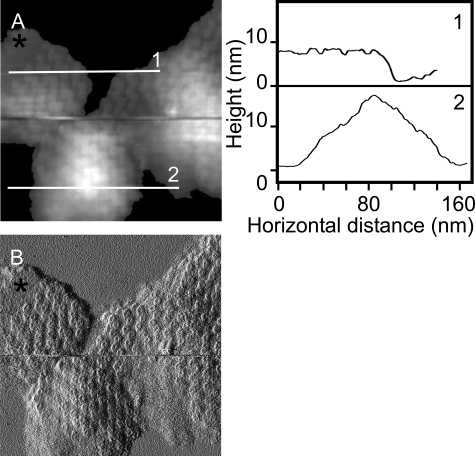
FIGURE 2.
Height and amplitude AFM topographs of flattened membrane patches. A, a height image of three membrane pieces. Section 1 shows that the upper left patch is essentially flat and well adsorbed to the mica with the contours of LH2 complexes defined in the trace, whereas section 2 across the lower patch has significantly more vertical topology yet still demonstrates the zigzag lines of complexes, which are clear in the amplitude image (B). A region of empty lipid is denoted by the black asterisk. Full gray scale, 20 nm. B, the amplitude image of the same region showing that even the highly curved membrane patch still has the regular zigzag lines of LH2 complexes traversing it.

