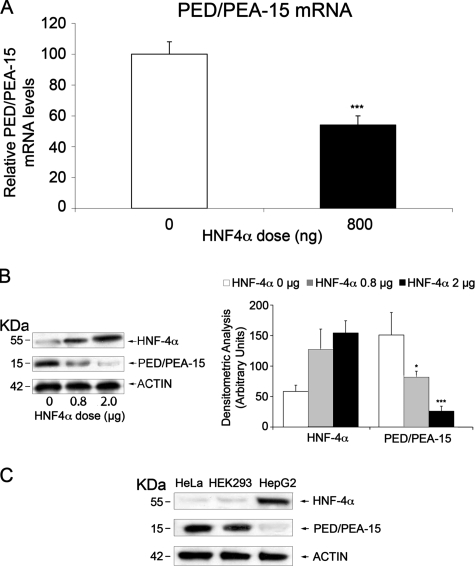
FIGURE 3.
Correlation between PED/PEA-15 and HNF-4α levels. A, HeLa cells were transfected with 0.8 μg of the pCDNA3/HNF-4α expression vector. PED/PEA-15 mRNA levels were then quantitated by RT-PCR. Data were normalized for β-actin mRNA and are expressed as % decrease versus control (untransfected cells). B, HeLa cells were transfected with the indicated amounts of the pCDNA3/HNF-4α vector DNA. The cells were then solubilized and Western-blotted with PED/PEA-15 antibodies followed by reblotting with HNF-4α antibodies. C, lysates from HeLa, HEK 293, and HepG2 cells (40 μg protein/sample) were analyzed by Western blotting with PED/PEA-15 antibodies followed by reblotting with HNF-4α and actin antibodies. All filters were revealed by ECL and autoradiography and quantitated by laser densitometry of the autoradiographs. Bars represent the means ± S.D. of three (B) and four (A) independent experiments. Asterisks denote statistically significant differences (*, p < 0.05; ***, p < 0.001). Representative blots are also shown.

