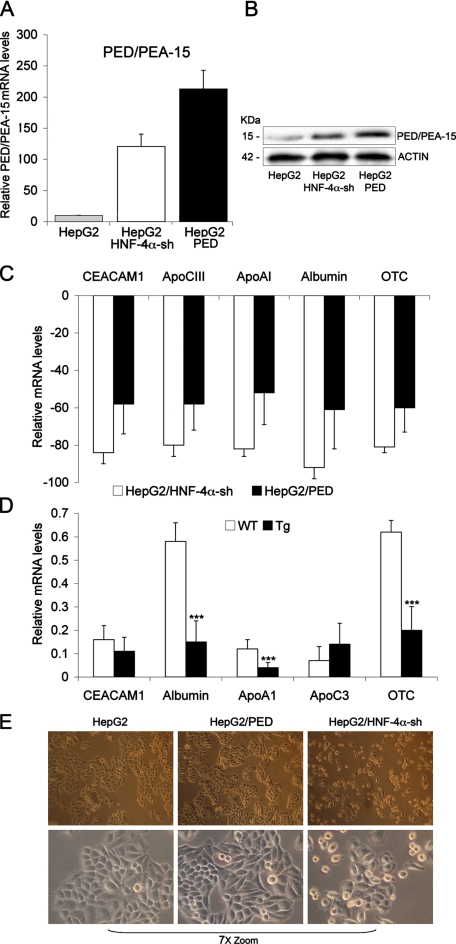
FIGURE 8.
PED/PEA-15 action on the expression of hepatocyte differentiation markers. A, total RNA preparations were obtained from HepG2 wild-type cells and from cells stably expressing either the HNF-4α-specific shRNA (HepG2/HNF-4α-sh) or the human PED/PEA-15 gene (HepG2/PED). B, lysates from HepG2 wild-type cells and from cells stably expressing either the HNF-4α-specific shRNA (HepG2/HNF-4α-sh) or the human PED/PEA-15 gene (HepG2/PED) (40 mg of protein/sample) were analyzed by Western blotting with PED/PEA-15 antibody followed by reblotting with actin antibody. The levels of PED/PEA-15 (A) CEACAM1, apoCIII, apoAI, albumin, and OTC mRNAs (C) were then quantitated by RT-PCR and normalized for β-actin mRNA. mRNA levels shown in the figure are relative to those in control (HepG2 wild type) cells. Bars represent the means ± S.D. of data from four independent experiments. D, RNA preparations were obtained from livers of ped/pea-15 transgenic and control mice (non-transgenic littermates). The indicated mRNAs were subsequently quantitated by RT-PCR and normalized for β-actin. Bars represent the means ± S.D. of four independent experiments, where reactions were performed in triplicate using pooled total RNA preparations from six mice/genotype. Asterisks denote statistically significant differences (p < 0.001). E, phase contrast microphotographs of HepG2, HepG2/PED, and HepG2/HNF-4α-sh cells (upper panel, 100× magnification; lower panel, 7×-zoomed microphotographs of the above fields).

