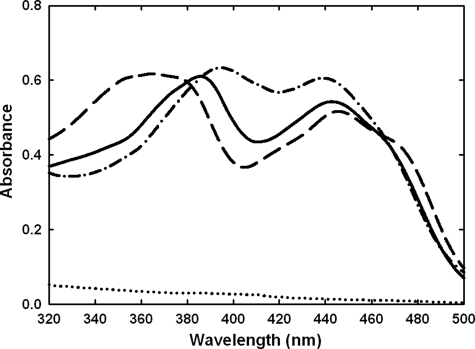
FIGURE 3.
Flavin absorption spectra. The spectra were recorded with a protein concentration of 2 mg/ml in 10 mm Tris-HCl (pH 7.6). Wild-type, solid line; H70A,—·—; C130A,———; and H70A/C130A, ······. These different spectra indicated a substantial change in the FAD microenvironment upon elimination of the 6-S-cysteinyl or 8α-N1-histidyl bond.

