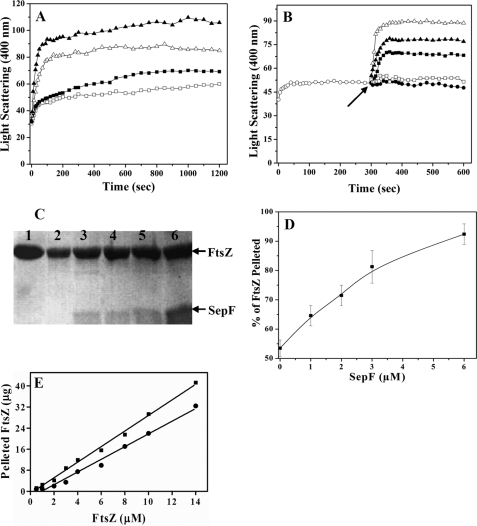
FIGURE 1.
SepF promoted the assembly of FtsZ. The effects of SepF on the assembly kinetics of FtsZ in 25 mm Pipes buffer, pH 6.8, containing 10 mm MgCl2 and 1 mm GTP were monitored by 90° light scattering (Panel A). FtsZ (3.4 μm) was polymerized in the absence (□) or presence of different concentrations of 1 μm (▪), 2 μm (▵), and 3 μm (▴) SepF (A). The experiment was performed three times. FtsZ (3.4 μm, ○) was polymerized in 25 mm Pipes buffer, pH 6.8, containing 10 mm MgCl2 and 1 mm GTP at 37 °C for 5 min (B). Then either different concentrations (1 μm, ▪;3 μm, ▴;6 μm, ▵) of SepF, (□) 6 μm BSA, or (•) 25 mm Pipes buffer, pH 6.8, were added to the cuvette, and the assembly of FtsZ was monitored for an additional 5 min. The arrow indicates the time of the addition of SepF and BSA to the assembly mixtures. The experiment was performed three times. SepF increased the sedimentable polymeric mass of FtsZ (C and D). FtsZ (3.4 μm) was polymerized in the absence and presence of different concentrations of SepF as described under “Experimental Procedures.” The polymers were collected by centrifugation, the pellets were dissolved, and the protein content in the pellets was estimated by Coomassie Blue staining of the 12% SDS-PAGE as described under “Experimental Procedures” (C). Lane 1 represents the total (polymeric plus soluble) FtsZ, and lanes 2-6 represent the polymeric FtsZ in the absence or presence of 1, 2, 3, and 6 μm SepF, respectively. The effects of SepF on the polymeric mass of FtsZ were estimated by densitometric analysis of the Coomassie Blue-stained SDS-PAGE (D). The data are the averages of five independent experiments. SepF reduced the critical concentration of FtsZ assembly (E). The symbols (• and ▪) represent the polymeric mass of FtsZ in the absence and presence of 3 μm SepF, respectively. The experiment was performed four times.

