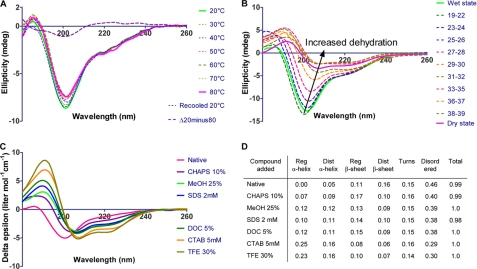
FIGURE 3.
SR-CD spectroscopy of LjIDP1. A, the SR-CD spectra of LjIDP1 showing the effect of temperature on the secondary structure. The spectrum of LjIDP1 has a large negative peak at ∼200 nm typical for an unfolded polypeptide and a small negative ellipticity at ∼220 nm due to β-sheet. Heating the sample from 20 to 80 °C has little effect on the CD spectrum. Note the small intensity and shape of the difference spectrum Δ(20-80 °C) that is similar to the CD spectrum of PPII. B, 70 consecutive SR-CD scans of LjIDP1 undergoing dehydration were collected. Virtually no changes were observed during the first 18 scans, so these were averaged and denoted “wet state.” All major structural changes occurred after 39 scans; therefore, spectra 40-70 were averaged and denoted “dry state.” The spectrum of LjIDP1 in the dry state is characterized by a positive peak at ∼190 nm and negative ellipticity at ∼208 nm and ∼222 nm typical for α-helix. C, SR-CD spectroscopy of LjIDP1 in the presence of different detergents and alcohols. Intriguingly, all agents tested induced α-helix at the expense of the β-sheet and disordered fractions. D, the table shows the quantified relative amounts of secondary structure elements.

