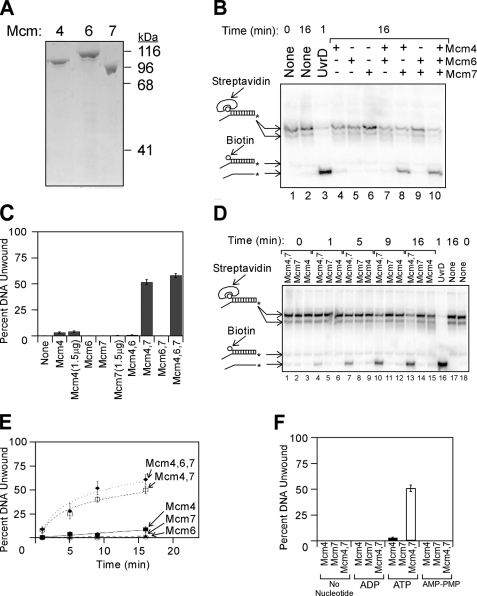
FIGURE 1.
Purified Mcm subunits can assemble into two different active unwinding complexes. A, purified Mcm4, Mcm6, and Mcm7 subunits were analyzed by SDS-PAGE and Coomassie Blue staining. The migration position of molecular weight standards is shown to the right of the gel. B, purified proteins were added to radiolabeled DNA substrate in the presence of ATP at 37 °C, and unwinding was determined by native gel analysis as described under “Experimental Procedures.” The DNA substrate is 32P-labeled duplex DNA bearing a 60(dT) 3′-single strand extension and a 5′-biotin bound to streptavidin. The radiolabeled DNA was incubated with no protein (lanes 1 and 2), UvrD (lane 3), or individually purified Mcm subunits (lanes 4-10) at 37 °C for the times indicated. DNA oligonucleotides used in these studies are described in supplemental Table 1, and the position of the radiolabel is indicated with an asterisk. DNA species in the gel were identified by comparison with standards analyzed in the same gel, and the mobility of each standard is indicated to the left of the gel. The streptavidin-bound oligonucleotides migrate in two different positions on the gel because streptavidin can form multimers. C, data from experiments similar to that shown in B were quantified, averaged, and plotted as mean ± S.E. (n ≥ 6). D, Mcm4, Mcm7, or an equimolar mixture of Mcm4/Mcm7 was incubated with radiolabeled DNA substrate for the time points indicated, and unwinding was monitored by native gel electrophoresis. E, data from experiments similar to that shown in D were averaged and plotted as mean ± S.E. as a function of time, and for each condition the data were then fit with a logarithmic or linear equation. The filled diamonds represent data with Mcm4, Mcm6, and Mcm7; the open squares are Mcm4 and Mcm7 data; the filled squares are Mcm4 data; the open circles are Mcm7 data; and the filled triangles are Mcm6 data. F, Mcm4, Mcm7, or an equimolar mixture of Mcm4/Mcm7 was mixed with the radiolabeled substrate in B for 16 min at 37 °C in the presence of different nucleotides. The fraction of substrate DNA unwound was determined and plotted as the mean ± S.E. for each condition (n ≥ 3).

