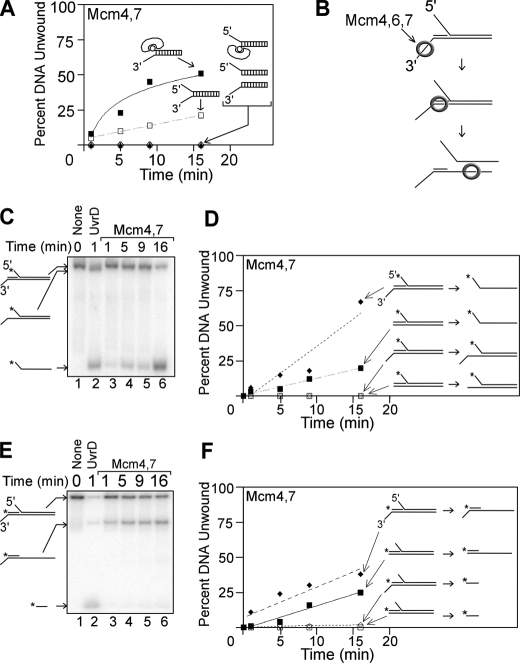
FIGURE 3.
The Mcm4/Mcm7 assembly unwinds DNA substrates with 3′-to 5′-polarity in a manner consistent with a steric exclusion mechanism. A, equimolar mixture of Mcm4/Mcm7 was incubated at 37 °C with various DNA substrates for the time points indicated, and unwinding was monitored by native gel electrophoresis as described under “Experimental Procedures.” The DNA oligonucleotides used in these experiments are detailed in supplemental Table 1. The time course data for each DNA substrate were fit with a logarithmic or linear equation. Each substrate is composed of identical dsDNA sequence bearing the following extensions: a 3′-60(dT)-ssDNA extension and a 5′-biotin-streptavidin (filled squares), a 3′-60(dT) ssDNA extension and a 5′-60(dT) ssDNA extension (open squares), a 5′-60(dT) ssDNA extension and a 3′-biotin-streptavidin (open diamonds), a 5′-60(dT) extension (filled triangles), and a 3′-60(dT) ssDNA extension (open circles). B, model of how Mcm4/Mcm6/Mcm7 unwinds a tandem duplex DNA substrate by a steric exclusion mechanism (35). The bottom strand is continuous, and the top strand bears a nick, creating two DNA duplexes in tandem. The left duplex bears a 3′-60(dT) ssDNA extension, and the right duplex bears a 5′-60(dT) ssDNA extension. Mcm4/Mcm6/Mcm7 unwinds only the right strand of this tandem duplex substrate. C, equimolar mixture of Mcm4/Mcm7 was incubated with a tandem duplex substrate and ATP at 37 °C for the time points indicated (lanes 3-6). The left duplex bears a 3′-60(dT) ssDNA extension, and the right duplex bears a 5′-60(dT) ssDNA extension. UvrD was used as a SF1 helicase family control (lane 2), and a no protein control is also shown (lane 1). D, data from experiments similar to C were quantified and plotted as a function of time. Data are shown for the tandem duplex substrate bearing a 3′-ssDNA extension (diamonds) and for a similar substrate that lacks the 3′-ssDNA extension (squares). For each DNA product, the time point data were fit to a linear equation. E, this experiment is similar to C, except a different strand is radiolabeled. F, data from experiments similar to E were quantified and plotted as a function of time for each DNA product.

