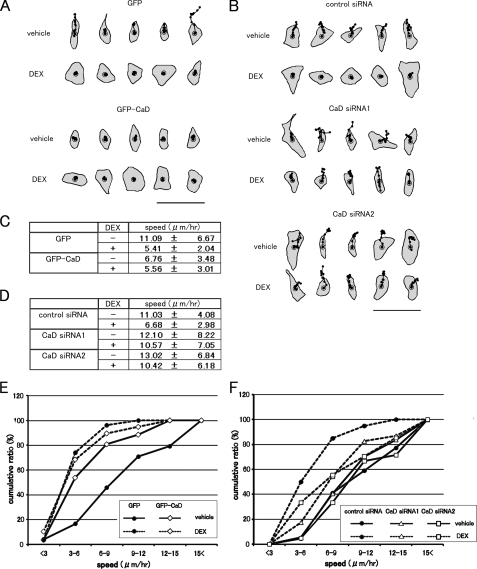
FIGURE 10.
Effect of forced expression or depletion of CaD on cell motility. A, cell motility was analyzed by tracing cell movement in time-lapse images, using DIAS software. GFP- or GFP-CaD-expressing A549 cells were incubated with vehicle or 1 μm DEX for 48 h, and representative centroid tracks of the cells are shown (25-min intervals for 5 h). Bar, 100 μm. B, A549 cells transfected with CaD siRNAs (CaD siRNA1 or CaD siRNA2) or control siRNA were incubated with vehicle or 1 μm DEX for 48 h, and representative centroid tracks of the cells are shown (25-min intervals for 5 h). Bar, 100 μm. C, migration speeds of GFP- or GFP-CaD-expressing A549 cells were calculated from the cell tracks (GFP-expressing cells: vehicle, n = 24; DEX, n = 27. GFP-CaD-expressing cells: vehicle, n = 26; DEX: n = 19) (mean ± S.D.). D, migration speeds of CaD-depleted A549 cells calculated from the cell tracks (control siRNA: vehicle, n = 22; DEX, n = 20. CaD siRNA1: vehicle, n = 37; DEX, n = 46. CaD siRNA2: vehicle, n = 21; DEX, n = 27) (mean ± S.D.). E, cumulative percentage plots of the migration speeds of GFP- and GFP-CaD-expressing A549 cells. GFP-expressing cells (•); GFP-CaD-expressing cells (⋄); -DEX (vehicle), solid lines; +DEX, dashed lines. F, cumulative percentage plots of the migration speeds of CaD-depleted and control A549 cells. Control siRNA-transfected cells (•); CaD siRNA1-transfected cells (Δ); CaD siRNA2-transfected cells (□); -DEX (vehicle), solid lines; and +DEX, dashed lines.

