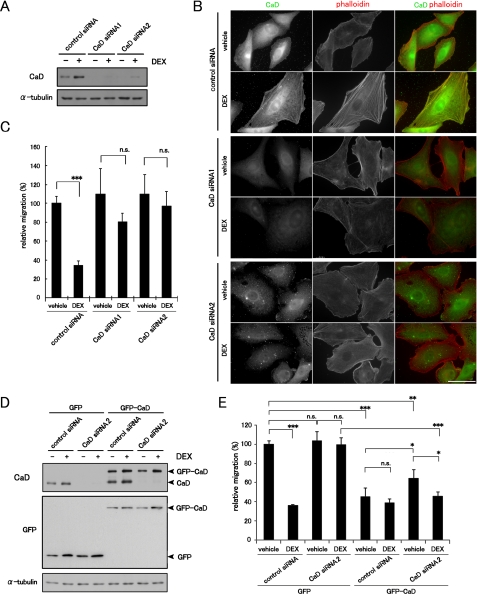
FIGURE 9.
Effects of CaD depletion on the actin cytoskeleton and cell migration. A, depletion of CaD expression using siRNA. A549 cells were transfected with CaD siRNAs or control siRNA, and incubated with or without 1 μm DEX for 48 h. The expression levels of CaD protein were detected by Western blot analysis. B, effect of CaD depletion on the formation of stress fibers in response to DEX. The cells were stained with anti-CaD antibody (green in merged image) and phalloidin (red in merged image). Bar, 50 μm. C, cell migration of CaD-depleted cells was measured in a Transwell migration chamber with or without 1 μm DEX (mean ± S.D., ***, p < 0.001). D, GFP-CaD expression counteracts the effects of endogenous CaD depletion. GFP- and GFP-CaD-expressing A549 cells transfected with CaD siRNA2 were incubated with or without 1 μm DEX. CaD siRNA2 repressed the expression of endogenous CaD, but not of exogenous GFP-CaD, which lacked the siRNA target, the 3′-untranslated region. E, cell migration of CaD siRNA2-transfected GFP-CaD- or GFP-expressing cells in a Transwell migration chamber with or without 1 μm DEX. (mean ± S.D., *, p < 0.05; **, p < 0.01; ***, p < 0.001; n.s., not significant).

