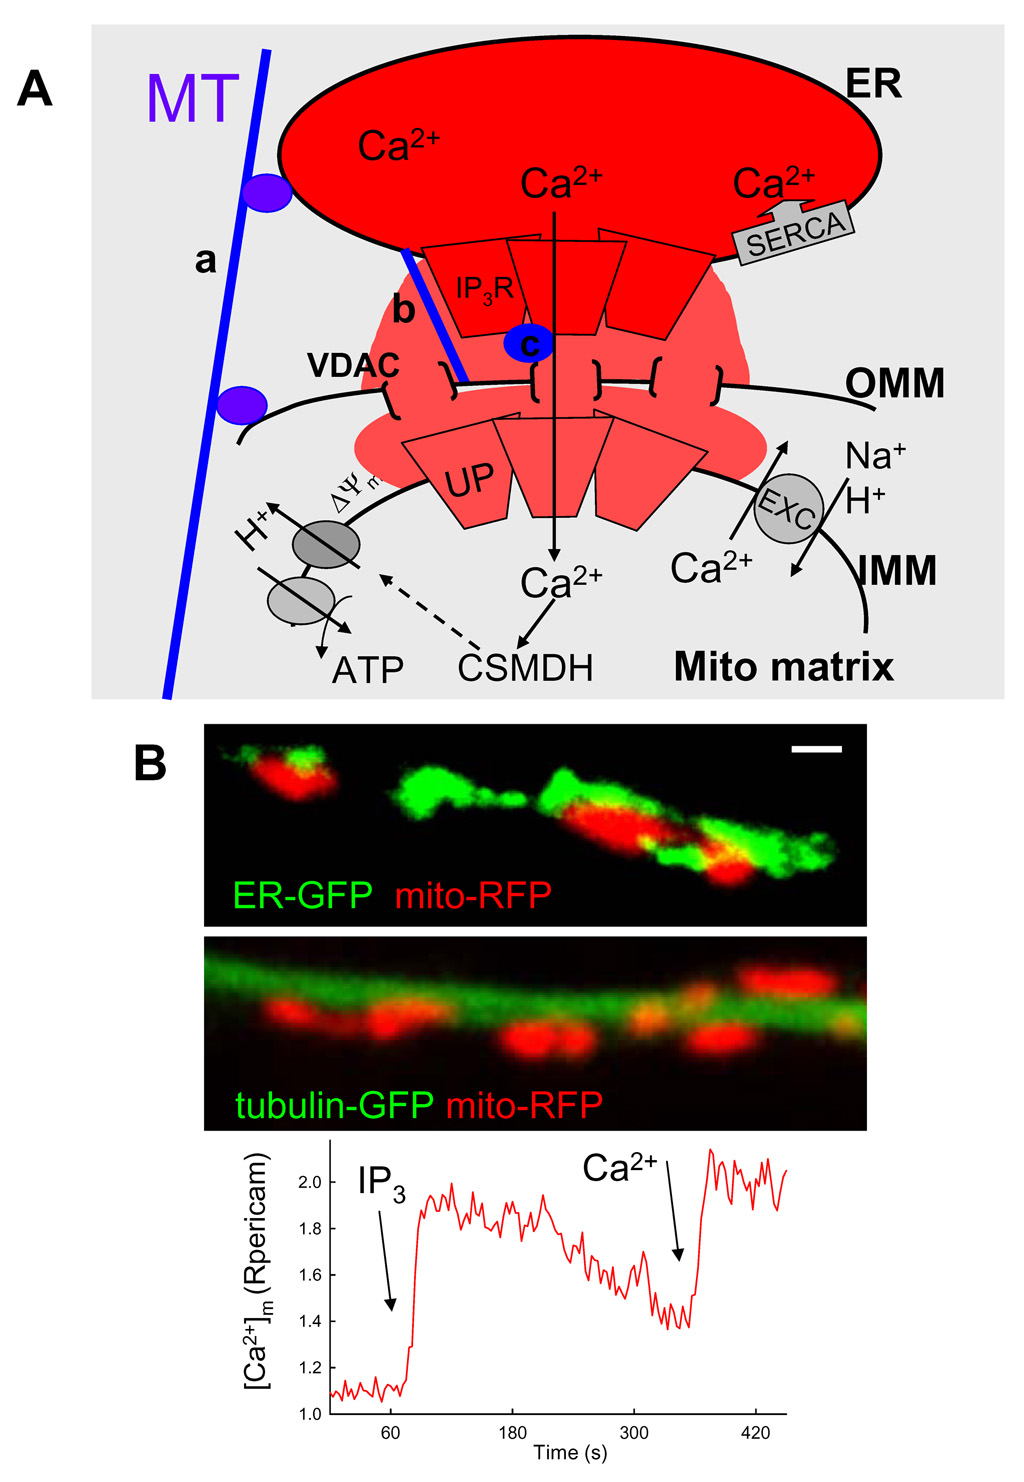
Fig1. Local coupling between ER and mitochondria.
(A) Scheme depicting the mechanisms of local Ca2+ transport and physical linkage between an ER stack and an adjacent mitochondrion. Ca2+ stored in the ER lumen is released through the IP3 receptors (IP3R) giving rise to a high [Ca2+] microdomain that exposes an adjacent mitochondrion. Ca2+ traverses the outer mitochondrial membrane (OMM) through the voltage dependent anion-selective channels (VDAC) and the inner mitochondrial membrane (IMM) via the uniporter (UP). In the mitochondrial matrix Ca2+ binds to the Ca2+ sensitive mitochondrial dehydrogenases (CSMDH) to stimulate energy metabolism. Ca2+ exits mitochondria through the Na+/Ca2+ or H+/Ca2+ exchanger (EXC) and is taken back to the ER by the Ca2+ pumps (SERCA). [Ca2+] is indicated by shades of red.
Components of the physical coupling between ER and mitochondria: a, binding of both ER and mitochondria to a microtubule (MT) or to other cytoskeletal fibers; b, protein tethering ER membrane directly to the mitochondria and c, multimolecular complexes involving both the IP3Rs and VDACs.
(B) Visualization of mitochondria and ER (upper), mitochondria and a microtubule (middle) and the IP3-induced mitochondrial calcium signal (lower) in a projection of an RBL-2H3 cell. Confocal imaging was performed in cells expressing either an ER-targeted enhanced green fluorescent protein (ER-GFP) and a mitochondrial matrix targeted red fluorescent protein (mito-RFP) (upper) or tubulin-targeted enhanced green fluorescent protein (tubulin-GFP) and mito-RFP (middle). The length of the scalebar is 1µm. Fluorescence imaging was conducted in mitochondrial matrix targeted ratiometric pericam expressing permeabilized cell sequentially stimulated with IP3 (7.5µM) and Ca2+ (30µM). The graph shows the time course of the pericam ratio calculated for a mitochondrion located in a projection.

