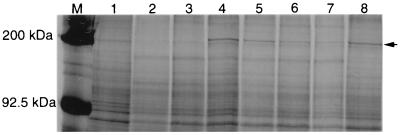
Figure 1.
SDS/PAGE screen for high expressing cell line. The cellular protein from each well of 96-well tissue culture plates was subjected to SDS/PAGE and stained with Coomassie blue. Lane M contains molecular mass markers. Lane 1 is the untransfected G9C cells. Lanes 2–11 are different clones of transfectants. The arrow indicates the band corresponding to CAD, which is observed only in lanes 4–8.

