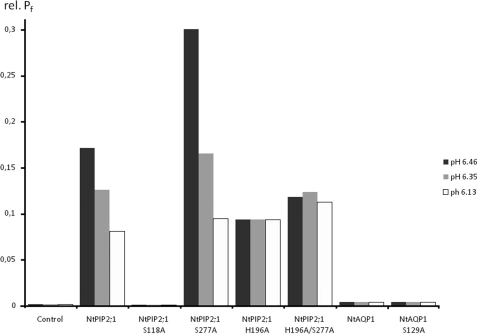
FIGURE 3.
Relative Pf (rel. Pf) values of yeast protoplasts expressing NtPIP2;1 or a mutated form of the protein. Permeability measurements at cytosolic pH of 6.46 are indicated by black bars; those performed at cytosolic pH 6.35 and 6.13 are represented by gray and light gray bars, respectively. (n = 30).

