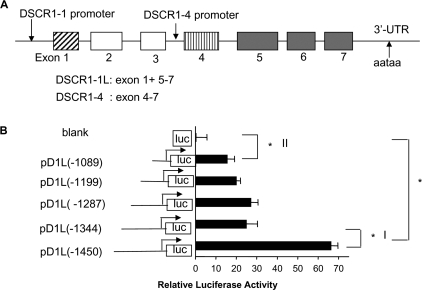
FIGURE 2.
Functional analysis of human DSCR1 promoter in hemangioma EOMA cells. A, schematic representation of the different promoter for DSCR1 isoform 1 and isoform 4. B, serial deletions of the DSCR1-1L promoter reporters and their relative luciferase activity in EOMA cells. A major positive regulatory region from -1450 bp to -1344 bp was identified in the DSCR1-1L promoter. The data are expressed as the means ± S.E. of three separate experiments (n = 6, *, denotes p < 0.001).

