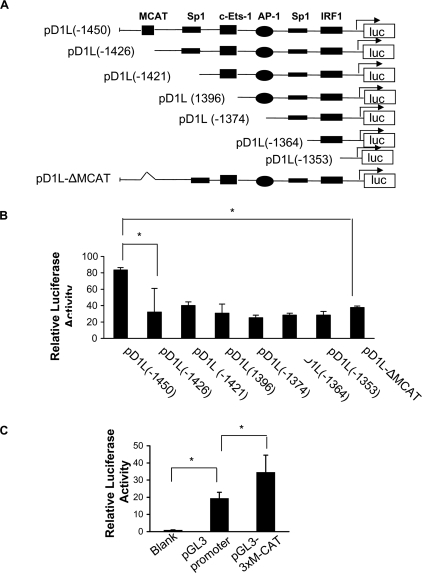
FIGURE 3.
Identification of an M-CAT-positive regulation site. A, diagram of serial shortening of the positive region I in the D1L promoter and the M-CAT deletion construct (ΔM-CAT). B, relative promoter activity of these deletion construct mutants in EOMA cells (n = 6, *, denotes p < 0.001). C, activity of the M-CAT reporter construct in EOMA cells (n = 6, *, denotes p < 0.001). The data are representative of three independent experiments.

