Abstract
The protonmotive force across the inner mitochondrial membrane (Δp) has two components: membrane potential (ΔΨ) and the gradient of proton concentration (ΔpH). The computer model of oxidative phosphorylation developed previously by Korzeniewski et al. (Korzeniewski, B., Noma, A., and Matsuoka, S. (2005) Biophys. Chem. 116, 145–157) was modified by including the K+ uniport, K+/H+ exchange across the inner mitochondrial membrane, and membrane capacitance to replace the fixed ΔΨ/ΔpH ratio used previously with a variable one determined mechanistically. The extended model gave good agreement with experimental results. Computer simulations showed that the contribution of ΔΨ and ΔpH to Δp is determined by the ratio of the rate constants of the K+ uniport and K+/H+ exchange and not by the absolute values of these constants. The value of Δp is mostly controlled by ATP usage. The metabolic control over the ΔΨ/ΔpH ratio is exerted mostly by K+ uniport and K+/H+ exchange in the presence of these processes, and by the ATP usage, ATP/ADP carrier, and phosphate carrier in the absence of them. The K+ circulation across the inner mitochondrial membrane is controlled mainly by K+ uniport and K+/H+ exchange, whereas H+ circulation by ATP usage. It is demonstrated that the secondary K+ ion transport is not necessary for maintaining the physiological ΔΨ/ΔpH ratio.
According to the Mitchell chemiosmotic theory (1), the intermediate that couples the electron flow through the respiratory chain with ATP synthesis by ATP synthase in the mitochondrial matrix is the protonmotive force (Δp) across the inner mitochondrial membrane. This thermodynamic potential is composed of two components: electrical membrane potential (ΔΨ) and the difference between the cytosolic and matrix pH (ΔpH).
The usual measured value of Δp is around 170–200 mV (2–9), although in older studies slightly higher values were encountered (10). This value may change depending on conditions, for instance with the intensity of ATP production by mitochondria. In the great majority of reports, the contribution of ΔΨ to Δp (u = ΔΨ/Δp) of 80–85% (0.8–0.85) was reported (2–10). This means that the value of ΔpH is around 30 mV (0.5 pH units) (2–10) (again, in older reports, values around 50 mV are sometimes reported (10)). On the other hand, Bose et al. (11) reported a very low ΔpH value, lower than 3 mV (0.05 pH units).
The contribution of ΔΨ and ΔpH to Δp is very important from the kinetic point of view, because ΔΨ and ΔpH exert a different influence on such elements of the system and processes as: complex III (C3),2 complex IV (C4), ATP/ADP carrier, phosphate carrier (12), proton leak (13), and reactive oxygen species (ROS) production (8). The ATP/ADP carrier is driven by ΔΨ, whereas the phosphate carrier is driven by ΔpH. Complex III transfers four protons but only two positive charges, whereas complex IV transfers two protons and four positive charges (12); therefore complex III is relatively more sensitive to ΔpH, whereas complex IV is to ΔΨ. The proton leak seems to be more sensitive to ΔΨ (13), while ROS production is to ΔpH (8). Therefore, the total value of Δp alone cannot define satisfactorily the kinetic properties of the oxidative phosphorylation system.
It is commonly accepted that the contribution of ΔΨ and ΔpH to Δp is determined by secondary transport of ions, especially potassium ions (K+), driven by building up the proton gradient across the inner mitochondrial membrane (12). It is also accepted that without this secondary transport, Δp would be almost exclusively (about 99%) in the form of ΔΨ, because, at the real electrical capacity of the inner mitochondrial membrane and the pH buffering capacity of the matrix, the transport of a very small amount of protons would build up the physiological value of Δp (12). It has been shown that Δp and its components do not depend very significantly on the extramitochondrial [K+] (5, 10), especially at higher physiological potassium ion concentrations. It has been observed in some studies (3, 10) that an increase in [Pi] from 0 to physiological values (10 mm) causes a significant decrease in Δp; at the same time ΔΨ slightly increases or remains constant after an initial decrease and ΔpH significantly decreases. On the other hand, Bose et al. encountered a significant increase in Δp and ΔΨ and a decrease in the very small ΔpH they measured.
Several trials of a quantitative description of the contribution of ΔΨ and ΔpH to Δp have been undertaken (14–16). These descriptions are based on different assumptions, give different predictions, and their verification by comparison with experimental data is limited. Generally, they are relatively simple and phenomenological. Recently Beard (17) developed a computer model of oxidative phosphorylation, based on the general structure of the model built by Korzeniewski et al. (18–22) that involves explicitly the K+ uniport, K+/H+ exchange across the inner mitochondrial membrane, and membrane capacitance. This model predicts a very low value of ΔpH (below 3 mV, 0.05 pH units), similar to that obtained in an experimental manner by Bose et al. (11).
The original model developed by Korzeniewski et al. (18–22) is able to reproduce, at least semiquantitatively, a broad range of different kinetic properties of the oxidative phosphorylation system in isolated mitochondria and intact tissues. However, this model uses a simplified, phenomenological description of the relationship between Δp, ΔΨ, and ΔpH: it assumes a fixed, constant contribution of ΔΨ to Δp, u = 0.861. This assumption was based on experimental data concerning state 4, state 3, and intermediate states in isolated mitochondria (2), but is certainly oversimplified and unsatisfactory under many conditions.
Metabolic Control Analysis (MCA) (23–25) has appeared to be an immensely useful quantitative tool for analyzing the dynamic behavior of biochemical systems. It was used in a great number of experimental and theoretical studies concerning the control of metabolic pathways (see Refs. 19, 26–30 for a few examples).
THEORETICAL PROCEDURES
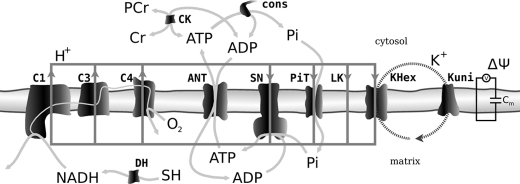
Computer Model—The computer dynamic model of oxidative phosphorylation in intact heart developed previously by Korzeniewski et al. (22) was extended to replace the fixed constant ΔΨ/Δp ratio (u = 0.861) with a more mechanistic description of ion transport across the inner mitochondrial membrane, similarly as it was done by Beard (17). The K+ uniport, K+/H+ exchange, and membrane capacitance were involved explicitly. The general scheme of the modeled system is presented in Fig. 1. The rates of K+ uniport (vKuni) and K+/H+ exchange (vKHex) are described by the following kinetic Equations 1 and 2,
 |
(Eq. 1) |
 |
(Eq. 2) |
where kKuni = 1.0·10-5 min-1 and kKHex = 3.485·10-3 min-1·μm-1 are rate constants in the “reference point” (see below). R, T, and F have the typical meanings, subscript e means extramitochondrial and subscript i means intramitochondrial.
FIGURE 1.
Scheme of the oxidative phosphorylation system. The elements of the system taken into account explicitly within the model of oxidative phosphorylation used in the present study are presented. Cm, membrane capacitance; ΔΨ, membrane potential.
The changes over time in intramitochondrial and extramitochondrial [H+] are described by the following differential Equations 3 and 4,
 |
(Eq. 3) |
 |
(Eq. 4) |
where Rcm = 3.35 is the ratio of the cell volume to
mitochondria volume in heart cells, buffHi is the matrix
proton-buffering coefficient, and buffHe is the cytosol
proton-buffering coefficient. Some fraction
 of
of  transported by phosphate
carrier (PiT) to the mitochondrial matrix dissociates to
 and H+, but
they are quickly used by ATP synthase, and therefore no net protons are
produced/consumed in the matrix. The opposite situation prevails in the
cytosol. An analogical situation is the production/consumption of
H+ (together with NADH) by the substrate dehydrogenation/complex I.
All these processes are not related to proton and/or charge transfer across
the inner mitochondrial membrane and therefore are not taken into account
explicitly within the model. Complex I (C1) transports (for 2 electrons) 4
H+ from matrix to cytosol; complex III (C3) takes up (for 2
electrons) 2 H+ from the matrix, and releases 4 H+ to
the cytosol; complex IV takes up (for 2 electrons or 1 oxygen atom) 4
H+ from the matrix (including 2 H+ for water molecule
formation) and releases 2 H+ to the cytosol; ATP synthase (SN)
transports nA = 2.5 protons from cytosol to matrix for one ATP
molecule synthesized; phosphate carrier (PiT), proton leak (LK), and
K+/H+ exchange (KHex) transport 1 H+ from
cytosol to matrix. All these processes are taken into account explicitly in
the model.
The changes over time in intramitochondrial [K+] are described by the following differential Equation 5.
 |
(Eq. 5) |
The potassium ion concentration in heart is very well regulated. (There are huge potassium stores in other tissues, especially in skeletal muscle, which can buffer the potassium concentration in heart (31).) Therefore, we assumed that the extramitochondrial (cytosolic) [K+] is constant. (This assumption also corresponds well to the isolated mitochondria system.) All the simulations presented below were performed under this assumption. However, we also tested the possibility that there is a constant cellular (cytosolic plus mitochondrial) pool of potassium ions and therefore Equation 6 applies.
 |
(Eq. 6) |
In both cases the theoretical results were similar (not shown), and therefore the above assumption is not particularly important for the properties of the system.
The changes over time in ΔΨ are described by Equation 7,
 |
(Eq. 7) |
where the inner mitochondrial membrane capacitance, Cm, is 1 μm/mV, as in Refs. 17 and 32. C1 transfers (for 2 electrons) 4 positive charges form matrix to cytosol; C3 transfers (per 2 electrons) 2 positive charges from matrix to cytosol (4 protons and 2 electrons); C4 transfers (for 2 electrons or 1 oxygen atom) 4 positive charges from matrix to cytosol (2 protons plus 2 electrons from cytosol to matrix); ATP synthase transfers nA = 2.5 positive charges from cytosol to matrix; ATP/ADP carrier, proton leak, and K+ uniport transport 1 positive charge from cytosol to matrix.
The reference point for the computer simulation carried out in the present study corresponded to a slowly beating intact heart (22). In this point, the following variable values were recorded: VO2 = 2.633 mm·min-1, [ATP]e = 6.663 mm, [ADP]e = 36.37 μm, [Pi]e = 2.351 mm, Δp = 181.9 mV, ΔΨ = 156.6 mV, ΔpH = 25.30 mV, (u = ΔΨ/Δp = 0.861), [H+]e = 0.1 μm, [H+]i = 0.03733 μm, [K+]e = 120 mm, [K+]i = 118.0 mm. The rate constants of K+ uniport and K+/H+ antiport were adjusted to be relatively quick and to give the u = ΔΨ/Δp value of 0.861 used in the original model (22): kKuni = 1.0·10-5 min-1 and kKHex = 3.485·10-3 min-1·μm–1.
The complete description of the model of oxidative phosphorylation with a mechanistic description of the relationship between ΔΨ and ΔpH in intact heart is located on the web site as supplemental material.
Metabolic Control Analysis—The most fundamental idea of MCA is based on the ratio of the relative change (dY/Y) in some variable Y caused by a small relative change (dX/X) in some parameter/variable X, to the latter change in Equation 8.
 |
(Eq. 8) |
In principle, these changes are infinitesimal, but in practice sufficiently small finite changes can be considered. In particular, control coefficients defined within MCA characterize the control exerted by particular components of a given metabolic system (enzymes, carriers, processes, and metabolic blocks) over different macroscopic properties (variables) of the system. Control coefficients are defined in Equation 9,
 |
(Eq. 9) |
where U is some property (variable) of the system and Ei is the activity/concentration of the i-th component of the system. Several control coefficients have been defined within MCA, concerning the control over the flux, metabolite concentrations, Δp etc. (see e.g. Refs. 7, 25, 28).
The metabolic control of particular elements of the oxidative phosphorylation system over Δp, u = ΔΨ/Δp, K+ cycling, and H+ cycling was calculated according to Equation 9 (U represented Δp; u, K+ cycling rate or H+ cycling rate). In subsequent computer simulations, the original rate constants of particular steps were increased by a relative factor of 0.01 (by 1%) and the relative changes in particular U-s between the original and the new steady state were recorded.
THEORETICAL RESULTS
First of all, our model predicts that in the reference point (that reflects the physiological conditions) there is a very small difference between the cytosolic and matrix potassium ion concentration (120.0 mm versus 118.0 mm, respectively) and ΔΨ is the dominant component of Δp. These properties of the model agree excellently with recent conclusions drawn by Nicholls (33): “In an intact cell, or with isolated mitochondria in a physiologically relevant high K+ medium, there is essentially no gradient of K+ across the inner mitochondrial membrane, the concentration being close to 120 mm in each compartment. Under these conditions, ΔpH is usually small...”.
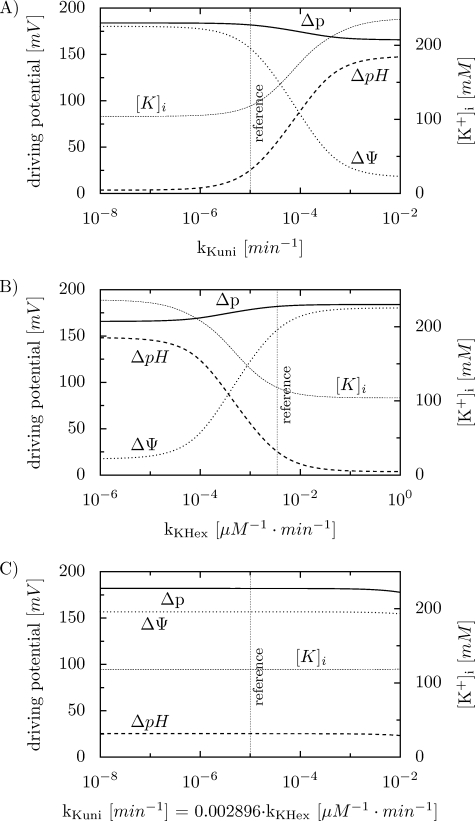
To simulate the dependence of Δp, ΔΨ, and ΔpH on kKuni, the value of this constant was changed by six orders of magnitude, while kKHex was kept constant. An increase in kKuni slightly decreases Δp, as it can be seen in Fig. 2A. However, ΔΨ and ΔpH change significantly with the increase in kKuni: ΔΨ strongly decreases and ΔpH strongly increases. At very low kKuni values, almost the entire Δp is in the form of ΔΨ. An increase in kKuni elevates the mitochondrial [K+], but these changes are rather moderate: in the whole range of kKuni an about 2-fold increase in [K+]i is observed.
FIGURE 2.
Simulated dependence of Δp, ΔΨ, ΔpH, and [K+]i on the rate constant of K+ uniport (kKuni) and K+/H+ exchange (kKHex). A, dependence on kKuni; B, dependence on kKHex; C, dependence on kKuni and kKHex at the fixed kKuni/kKHex ratio equal to 2.896·10-3.
The dependence of Δp, ΔΨ, and ΔpH on kKHex is opposite to the dependence on kKuni, as it can be seen in the simulations shown in Fig. 2B. In these simulations, kKHex was changed by six orders of magnitude, while kKuni was kept constant. An increase in kKHex slightly increases Δp, strongly increases ΔpH, and strongly decreases ΔΨ. At very high kKHex values, almost the entire Δp is in the form of ΔΨ.[K+]i drops about twice with the increase in kKHex.
The above simulations clearly show that the contribution of ΔΨ and ΔpH to Δp strongly depends on the absolute values of the rate constants of the K+ uniport and K+/H+ antiport: kKuni and kKHex. However, when the values of these constants are changed in parallel in relation to the reference point, by the same factor, and thus the ratio of the rate constants is kept constant (kKuni/kKHex = 2.896·10-3 in the reference point), the value of Δp and the ΔΨ/ΔpH ratio are essentially unaffected. This is shown in Fig. 2C. Therefore, the contribution of ΔΨ and ΔpH to Δp is determined by the relative values (ratio) of kKuni and kKHex. It is also worth noticing that [K+]i remains constant at the constant kKuni/kKHex ratio. At very high values of kKuni and kKHex (for the constant kKuni/kKHex ratio), the values of ΔΨ, ΔpH, and Δp slightly decrease, because the very quick K+ circulation and thus K+/H+ exchange prevailing under such conditions leads to a significant dissipation of Δp. Whereas the K+/H+ exchange contributes in 0.044% to the overall H+ cycling in the reference point, this contribution increases to 36% at the right-most point in Fig. 2C.
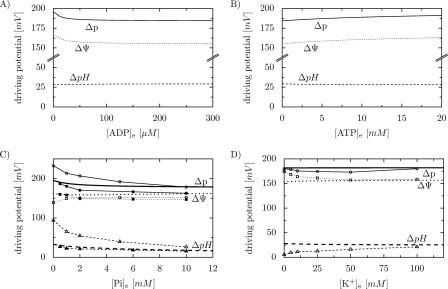
A decrease in the extramitochondrial phosphorylation potential brought about by an increase in either [ADP] or [Pi] (with other external metabolite concentrations, i.e. [ATP] and [Pi] or [ATP] and [Pi], kept constant) leads to a decrease in Δp, while the increase in the extramitochondrial phosphorylation potential related to an increase in [ATP] ([ADP] and [Pi] kept constant) is accompanied by an increase in Δp (see Fig. 3, A–C). However, the relative contribution of ΔΨ and ΔpH to Δp changes with changes in [ADP], [ATP], and [Pi]. While ΔΨ follows the decrease in Δp with an increase in [ADP] and the increase in Δp with an increase in [ATP], ΔpH slightly increases in the first case and slightly decreases in the second. An even more interesting situation takes place in the case of an increase in [Pi], here at higher Pi concentrations ΔΨ slightly increases (after an initial decrease), at the cost of a significant decrease in ΔpH. Therefore, the contribution of ΔΨ to Δp increases of course at higher [Pi]. The simulated dependence of Δp, ΔΨ, and ΔpH on [Pi] is compared in Fig. 3C with experimental data by Kunz et al. (3) and Nicholls (10). Generally, a good agreement can be observed (see “Discussion” for details). In our simulations, Δp, ΔΨ, and ΔpH are essentially independent of the extramitochondrial K+ concentration (Fig. 3D) (in this theoretical analysis, different constant [K+]e in the range between 0 and 120 mm were fixed in subsequent simulations) although at low [K+] the system approaches the steady state very slowly (starting from the reference point) because the K+ uniport and K+/H+ exchange are very slow (not shown). Our simulations are compared in Fig. 3D with experimental data by Czyż et al. (5). Again, a good agreement can be observed (see also “Discussion”).
FIGURE 3.
Simulated dependence of Δp, ΔΨ, and ΔpH on extramitochondrial [ADP] (A), [ATP] (B), [Pi] (C), and [K+] (D). Thick lines without points, computer simulations; points connected with thin lines, experimental data; solid lines, Δp; dotted lines, ΔΨ; dashed lines, ΔpH; full symbols in C, data from Ref. 3; empty symbols in C, data from Ref. 10; empty symbols in D, data from Ref. 5.
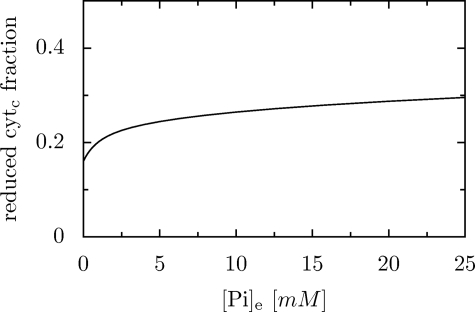
The increase in [Pi] causes an increase in the rate of oxygen consumption and ATP synthesis (not shown) and an increase in the reduction level of cytochrome c (see Fig. 4). This effect is not related to the activation of complex III by Pi, because such activation is not included in our model.
FIGURE 4.
Simulated dependence of the reduction level of cytochrome c on extramitochondrial [Pi].
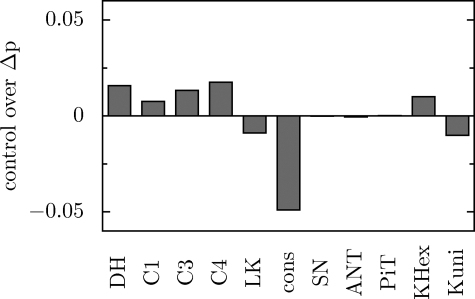
The absolute value of Δp is controlled to the greatest extent by the ATP demand, although the control is distributed among essentially all components of the system. This is shown in Fig. 5. Generally, the processes that participate (directly or indirectly) in the production of Δp (substrate dehydrogenation, complex I, complex III, and complex IV) have a positive control, while the processes dissipating Δp (ATP usage, proton leak) have a negative control over Δp. The sum of the concentration control coefficients over Δp equals zero (negative controls counter-balance positive controls), in agreement with the so-called connectivity property (25).
FIGURE 5.
Simulated control coefficients of particular components of the system over Δp.
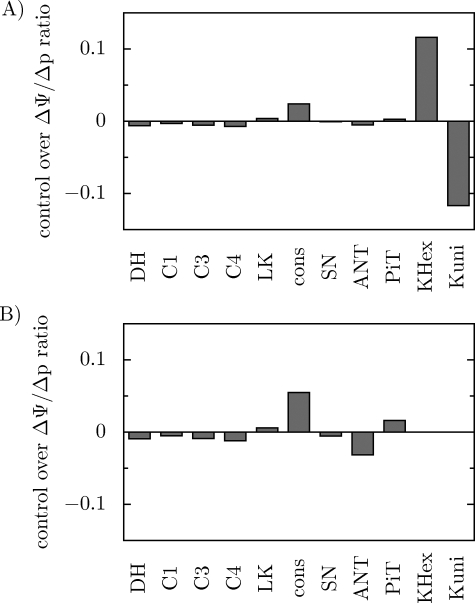
In the presence of K+ uniport and K+/H+ antiport, just these two processes control to the greatest extent the contribution of ΔΨ and ΔpH to Δp. As can be seen in Fig. 6A, K+ uniport has a great negative control over u = ΔΨ/Δp, while K+/H+ antiport has a great positive control over this variable. ATP usage has a moderate positive control over u, and the contribution of the remaining steps to the control is minor.
FIGURE 6.
Simulated control coefficients of particular components of the system over u = ΔΨ/Δp. A, in the presence of K+ uniport and K+/H+ exchange; B, in the absence of K+ uniport and K+/H+ exchange.
In the absence of K+ uniport and K+/H+ antiport (kKuni and kKHex set to 0) the metabolic control over u is exerted mainly by ATP usage and phosphate carrier (positive control) and ATP/ADP carrier (negative control) (Fig. 6B). Other components control this variable to a smaller extent. Under these conditions u = 0.847, which is similar to u = 0.861 in the presence of K+ uniport and K+/H+ antiport. Therefore, the system is able to regulate effectively the contribution of ΔΨ and ΔpH to ΔΨ even without the secondary K+ transport.
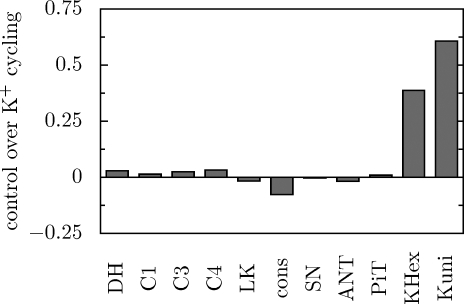
The rate of K+ cycling across the inner mitochondrial membrane is controlled mostly by the processes directly participating in this cycling: K+ uniport and K+/H+ exchange. This is shown in Fig. 7. Both processes exert positive control of comparable size (the control by the H+/K+ exchange is somewhat higher). The H+ cycling across the inner mitochondrial membrane is controlled to the greatest extent by ATP usage (not shown).
FIGURE 7.
Simulated control coefficients of particular components of the system over the K+ circulation flux.
DISCUSSION
One of the most important findings of the present study is that the contribution of ΔΨ and ΔpH to Δp is determined by the relative activity of the K+ uniport and K+/H+ antiport. The simulations presented in Fig. 2 clearly demonstrate that it is not the absolute values of the rate constants of K+ uniport and K+/H+ antiport (kKuni and kKHex, respectively), but the ratio of these rate constants that determines the value of parameter u = ΔΨ/Δp. Significant variations in either kKuni or kKHex, when the other rate constant remains unchanged, significantly affect the contribution of ΔΨ and ΔpH to Δp (Fig. 2, A and B). On the other hand, an increase in both rate constants by six orders of magnitude has only an insignificant effect on Δp, ΔΨ, and ΔpH when the kKuni/kKHex ratio is fixed at 2.896·10-3.
Extramitochondrial ADP decreases and extramitochondrial ATP increases Δp and ΔΨ, whereas a small opposite effect on ΔpH is observed (Fig. 3, A and B). Such a behavior of the system is not surprising, because a high external [ADP] activates the ATP/ADP carrier, accelerates the dissipation of ΔΨ and thus increases the contribution of ΔpH to Δp, while a high external [ATP] has the opposite effect. However, one must bear in mind that the potential effect of [ATP] on the mitoKATP channel is not included in our simple model. On the other hand the half-inhibiting [ATP] for this channel is very low, in the micromolar range (34).
An increase in the extramitochondrial [Pi] decreases Δp and ΔpH, but slightly increases (at higher concentrations) ΔΨ. This simulated behavior of the system is generally similar to the experimental results obtained by Nicholls (10) and Kunz et al. (3), as shown in Fig. 3C. The contribution of ΔpH to Δp was probably somewhat overestimated in Ref. 10, because small amounts of valinomycin were used in that study to allow Rb+ flow across the inner mitochondrial membrane; valinomycin dissipates ΔΨ and thus builds up ΔpH. In the more recent study (3), DDA+ that does not need valinomycin was used to determine ΔΨ.
On the other hand, Bose et al. (11) observed a significant (much higher than in our simulations, but the qualitative tendency is similar) Pi-induced increase in ΔΨ, but they measured a very low value of ΔpH, below 3 mV (0.05 pH units), which is not what was usually observed by other investigators (2–10). It is not clear if these differences are due to different experimental systems and conditions used (resulting in e.g. different values of kKuni and/or kKHex) or different methods of ΔΨ and (especially) ΔpH determination.
Our simulations predict that Δp, ΔΨ, and ΔpH are essentially independent of extramitochondrial K+ concentration (Fig. 3D). These theoretical predictions are generally similar to the experimental data obtained by Czyż et al. (5), although the authors observed that ΔΨ slightly increases and ΔpH slightly increases at low, unphysiological [K+]e. A similar behavior of the system was encountered by Nicholls (10). Of course this (rather insignificant, considering low [K+]) difference between model predictions and experimental data can be caused by the fact that within the model, the kinetic description of K+ uniport and K+/H+ antiport is oversimplified and does not work properly at very low [K+]. Another possibility is that, as discussed above, the system approaches very slowly a steady-state at low [K+], and therefore the steady-state had not been reached in the discussed experimental studies. Indeed, computer simulations demonstrated that a dependence of ΔΨ and ΔpH on [K+] similar to that seen in Refs. 5, 10 can be easily obtained if the values of ΔΨ and ΔpH from the transient state preceding the steady state are plotted in the diagram (not shown).
The decrease in the contribution of ΔpH to Δp with the increase
in [Pi] from 0 to physiological values can be explained as follows.
The phosphate carrier carries out the transport of
 from cytosol to the
mitochondrial matrix coupled with the transport of H+ to the
matrix. Therefore, fast action of this carrier causes intensive ΔpH
dissipation. At low Pi concentrations, this carrier is inhibited,
and therefore the dissipation of ΔpH is restricted, which leads to a
relatively higher contribution of ΔpH to Δp. An increase in
[Pi] abolishes this effect and causes a decrease of the ΔpH
contribution and thus an increase in the ΔΨ contribution to
Δp.
Fig. 4 shows that an increase in [Pi] from 0 to physiological values results in an increase in the reduction level of cytochrome c. It has been postulated by Bose et al. (11) that the Pi-induced increase in ΔΨ and cytochrome c reduction level constitutes evidence for a direct activation of complex III of the respiratory chain by extramitochondrial inorganic phosphate. However, the present studies do not confirm this proposition, because both effects can be accomplished by a computer model of oxidative phosphorylation that does not involve the possible activation of complex III by Pi (although we have to admit that the simulated increase in ΔΨ is very small).
The model developed by Beard (17) predicts that almost the entire Δp is in the form of ΔΨ, and therefore ΔpH is very low, in accordance with the experimental results obtained in Ref. 11. However, this prediction is simply a consequence of the assumption that there is no passive potassium flux (kKuni = 0) and that the K+/H+ exchange is very active (17). If a lower rate constant of the K+/H+ exchange is assumed, along with a non-zero rate constant of K+ uniport, as is done in the present study, a much higher value of ΔpH of about 30 mV is obtained, in agreement with the great majority of experimental data coming from different laboratories (2–10).
It is not surprising that ATP usage has the greatest (negative) control over the absolute value of Δp (Fig. 5), because ATP usage is the main process determining ATP turnover. An increase in the intensity of this process leads to a decrease in the cytosolic phosphorylation potential. This decrease is transferred (through the ATP/ADP carrier and phosphate carrier) to the mitochondrial phosphorylation potential and then (through ATP synthase) to the protonmotive force (Δp). The proton leak dissipates Δp, and therefore it also has a negative control. However, the fraction of protons returning to the matrix by this process is relatively small (17% in a slowly beating heart within the model), which results in a relatively small control coefficient.
The presented theoretical results agree very well with the experimental determination of the control of oxidative subsystem (substrate dehydrogenation, complex I, complex III, and complex IV), phosphorylation subsystem (ATP synthase, ATP/ADP carrier, phosphate carrier, ATP usage), and proton leak subsystem over Δp carried out within the frame of the `top-down approach' to MCA (7, 35).
In the presence of K+ uniport and K+/H+ antiport, the contribution of ΔΨ to Δp (parameter u) is mainly controlled just by these processes (Fig. 6A). The magnitude of the control is identical for both processes, but has the opposite sign. The K+ uniport (leak) dissipates ΔΨ and therefore exerts a negative control over u = ΔΨ/Δp, whereas the K+/H+ uniport dissipates ΔpH and therefore its control over u is positive. The equal in size but oppositely-directed control exerted by the K+ uniport and K+/H+ explains why the contribution of ΔΨ and ΔpH to Δp remains essentially unaffected when the activities (rate constants) of both processes are changed in parallel by the same relative factor (Fig. 2C).
Our model predicts that the system seems to be able to regulate efficiently the contribution of ΔΨ and ΔpH to Δp even without the secondary K+ transport. The simulations shown in Fig. 6B explain the basis of this surprising system property. Namely, in the absence of K+ circulation, the control over u is taken over by ATP usage, ATP/ADP carrier, and phosphate carrier. ATP usage had already a significant control in the presence of the K+ uniport and K+/H+ antiport, because a decrease in Δp causes an increase in u. On the other hand, in the absence of the secondary K+ transport, the ATP/ADP carrier and phosphate carrier seem to take over the role of K+ uniport and K+/H+ antiport in determining the ΔΨ/ΔpH ratio. This is logical, because the ATP/ADP carrier dissipates ΔΨ (as the K+ uniport) and the phosphate carrier dissipates ΔpH (as the K+/H+ antiport).
It is also noteworthy that the obtained simulation results do not depend qualitatively on the value of membrane capacitance Cm, because changing this parameter within several orders of magnitude has only a minor influence on the distribution of Δp between ΔΨ and ΔpH (1% relative change in the value of parameter u) without a significant change in Δp (results not shown).
The rate of K+ circulation across the inner mitochondrial membrane is mostly controlled by K+ uniport and K+/H+ antiport (Fig. 7). The control exerted by the latter is somewhat greater, because the former is very sensitive to the dominant component of Δp: ΔΨ, appearing in the power expression (Equation 1). According to the Metabolic Control Analysis paradigm, the greater the sensitivity to metabolite concentrations (or thermodynamic forces), the lower the control over the flux, and the inverse (25).
Of course, the model developed in the present study contains several simplifications. A simple kinetics (linear dependence of rates on ion concentrations) of the K+ uniport and K+/H+ exchange was assumed. Constant cytosolic and mitochondrial free [Mg2+] was assumed; this assumption is justified by the presence of a significant magnesium binding pool in both compartments (36) and by the essentially constant [ATP] (changes in [ATP] caused by AMP deamination are potentially the greatest source of short-term variations in [Mg2+]). It is also widely accepted, that the matrix [Mg2+] modulates K+/H+ antiport activity. Nevertheless, under physiological magnesium concentrations, exchanger inhibition is reported to be already saturated, and moderate [Mg2+] changes should not significantly affect exchanger turnover rate (37). It was assumed that the mitochondrial matrix volume is substantially constant in intact tissues. (This is certainly not the case in isolated mitochondria.) Nevertheless, it seems unlikely that the general theoretical results obtained in the present study depend significantly on these assumptions.
The present theoretical study is important for understanding the functioning of the system. As mentioned in the Introduction, various oxidative phosphorylation complexes, proton leak, and free radical production are differentially regulated by ΔΨ and ΔpH. The distribution of control over u = ΔΨ/ΔpH among particular oxidative phosphorylation complexes may be particularly important in pathological conditions, especially in the case of inborn enzyme deficiencies (causing mitochondrial diseases, Ref. 38), where an elevated free radical production is one of the most important pathogenic factors.
Summing up, in the present study the computer model of oxidative phosphorylation developed previously by Korzeniewski et al. was extended by including explicitly the K+ uniport, K+/H+ exchange, and capacitance of the inner mitochondrial membrane. Computer simulations demonstrated that the ΔΨ/ΔpH ratio is mainly determined by the relative activities (rate constants) of the K+ uniport and K+/H+ exchange rather than by the absolute values of these activities. It was shown that the absolute value of Δp is mainly controlled by ATP usage, although the control is distributed among essentially all components of the system. The model predicted that in the presence of the K+ uniport and K+/H+ antiport, the metabolic control (defined according to the Metabolic Control Analysis paradigm) over the contribution of ΔΨ to Δp (u = ΔΨ/Δp) is exerted mainly by these processes, while in the absence of them, by ATP usage, ATP/ADP carrier, and Pi carrier. It is shown that K+ circulation across the inner mitochondrial membrane is controlled by K+ uniport and K+/H+ antiport. Finally, it was postulated that the system is able to control effectively the physiological ΔΨ/ΔpH ratio even without the secondary K+ transport system.
Supplementary Material
The costs of publication of this article were defrayed in part by the payment of page charges. This article must therefore be hereby marked “advertisement” in accordance with 18 U.S.C. Section 1734 solely to indicate this fact.
The on-line version of this article (available at http://www.jbc.org) contains supplemental material.
Footnotes
The abbreviations used are: C3, complex III; ROS, reactive oxygen species; i, intramitochondrial; e, extramitochondrial; DH, substrate dehydrogenation; C1, complex I; C4, complex IV; SN, ATP synthase; ANT, ATP/ADP carrier; PiT, phosphate carrier; cons, ATP consumption; LK, proton leak; Kuni, K+ uniport; KHex, K+/H+ exchange; MCA, Metabolic Control Analysis.
References
- 1.Mitchell P. (1961) Nature 191 144-148 [DOI] [PubMed] [Google Scholar]
- 2.Duszyński, J., Bogucka, K., and Wojtczak, L. (1984) Biochim. Biophys. Acta 767 540-547 [DOI] [PubMed] [Google Scholar]
- 3.Kunz, W., Gellerich, F. N., Schild, L., and Schönfeld, P. (1988) FEBS Lett. 233 17-21 [DOI] [PubMed] [Google Scholar]
- 4.Ouhabi, R., Rigoulet, M., Lavie, J.-L., and Guérin, B. (1991) Biochim. Biophys. Acta 1060 293-298 [DOI] [PubMed] [Google Scholar]
- 5.Czyż, A., Szewczyk, A., Nałęcz, J., and Wojtczak, L. (1995) Biochem. Biophys. Res. Commun. 210 98-104 [DOI] [PubMed] [Google Scholar]
- 6.Rigoulet, M., Fraisse, L., Ouhabi, R., Guérin, B., Fontaine, E., and Leverve, X. (1990) Biochim. Biophys. Acta 1018 91-97 [DOI] [PubMed] [Google Scholar]
- 7.Hafner, R. P., Brown, G. C., and Brand, M. D. (1990) Eur. J. Biochem. 188 313-319 [DOI] [PubMed] [Google Scholar]
- 8.Lambert, A. J., and Brand, M. D. (2004) Biochem. J. 382 511-517 [DOI] [PMC free article] [PubMed] [Google Scholar]
- 9.Nobes, C. D., Brown, G. C., Olive, P. N., and Brand, M. D. (1990) J. Biol. Chem. 265 12903-12909 [PubMed] [Google Scholar]
- 10.Nicholls, D. G. (1974) Eur. J. Biochem. 50 305-315 [DOI] [PubMed] [Google Scholar]
- 11.Bose, S., French, S., Evans, F. J., Joubert, F., and Balaban, R. S. (2003) J. Biol. Chem. 278 39115-39165 [DOI] [PubMed] [Google Scholar]
- 12.Nicholls, D. G., and Ferguson, S. J. (2002) Bioenergetics, vol. 3, Academic Press, London
- 13.Krishnamoorthy, G., and Hinkle, P. C. (1984) Biochemistry 23 1640-1645 [DOI] [PubMed] [Google Scholar]
- 14.Reich, J. G., and Rohde, K. (1983) Biomed. Biochim. Acta 1 37-46 [PubMed] [Google Scholar]
- 15.Schuster, S., and Mazat, J.-P. (1993) Modern Trends in BioThermoKinetics, pp. 39-44, Plenum Press, New York
- 16.Schuster, S., Ouhabi, R., Rigoulet, M., and Mazat, J.-P. (1998) Bioelectrochem. Bioenerg. 45 181-192 [Google Scholar]
- 17.Beard, D. A. (2005) PLoS Comput. Biol. 1 e36. [DOI] [PMC free article] [PubMed] [Google Scholar]
- 18.Korzeniewski, B., and Froncisz, W. (1991) Biochim. Biophys. Acta 1060 210-223 [DOI] [PubMed] [Google Scholar]
- 19.Korzeniewski, B., and Mazat, J.-P. (1996) Biochem. J. 319 143-148 [DOI] [PMC free article] [PubMed] [Google Scholar]
- 20.Korzeniewski, B. (1998) Biochem. J. 330 1189-1194 [DOI] [PMC free article] [PubMed] [Google Scholar]
- 21.Korzeniewski, B., and Zoladz, J. A. (2001) Biophys. Chem. 92 17-34 [DOI] [PubMed] [Google Scholar]
- 22.Korzeniewski, B., Noma, A., and Matsuoka, S. (2005) Biophys. Chem. 116 145-157 [DOI] [PubMed] [Google Scholar]
- 23.Kacser, H., and Burns, J. (1973) Rate Control of Biological Processes, pp. 65-104, Cambridge University Press, Cambridge [PubMed]
- 24.Heinrich, R., and Rapaport, T. (1974) Eur. J. Biochem. 42 89-95 [DOI] [PubMed] [Google Scholar]
- 25.Fell, D. (1992) Biochem. J. 286 313-330 [DOI] [PMC free article] [PubMed] [Google Scholar]
- 26.Rais, B., Heinrich, R., Malgat, M., and Mazat, J.-P. (1993) Modern Trends in BioThermoKinetics, pp. 269-274, Plenum Press, New York
- 27.Brown, G. (1994) Biochem. J. 197 115-122 [DOI] [PMC free article] [PubMed] [Google Scholar]
- 28.Groen, A., Wanders, R., Westerhoff, H., van der Meer, R., and Tager, J. (1982) J. Biol. Chem. 157 2754-2757 [PubMed] [Google Scholar]
- 29.Jeneson, J., Westerhoff, H., and Kushmerick, M. (2000) Am. J. Physiol. 279 C813-C832 [DOI] [PubMed] [Google Scholar]
- 30.Wisniewski, E., Gellerich, F., and Kunz, W. (1995) Eur. J. Biochem. 230 549-554 [DOI] [PubMed] [Google Scholar]
- 31.Sejersted, O. M., and Sjøgaard, G. (2000) Physiol. Rev. 80 1422-1481 [DOI] [PubMed] [Google Scholar]
- 32.Cortassa, S., Aon, M. A., Marbán, E., Winslow, R. L., and O'Rourke, B. (2003) Biophys. J. 84 2734-2755 [DOI] [PMC free article] [PubMed] [Google Scholar]
- 33.Nicholls, D. G. (2005) Biochim. Biophys. Acta 1710 63-65 [DOI] [PubMed] [Google Scholar]
- 34.Garlid, K., and Paucek, P. (2003) Biochim. Biophys. Acta 1606 23-41 [DOI] [PubMed] [Google Scholar]
- 35.Dufour, S., Rousse, N., Canioni, P., and Diolez, P. (1996) Biochem. J. 314 743-751 [DOI] [PMC free article] [PubMed] [Google Scholar]
- 36.Corkey, B. E., Duszyński, J., Rich, T. J., Matschinsky, B., and Williamson, J. R. (1986) J. Biol. Chem. 261 2567-2574 [PubMed] [Google Scholar]
- 37.Bernardi, P. (1999) Physiol. Rev. 79 1127-1155 [DOI] [PubMed] [Google Scholar]
- 38.Wallace, D. C. (1987) Birth Defects 23 137-190 [PubMed] [Google Scholar]
Associated Data
This section collects any data citations, data availability statements, or supplementary materials included in this article.


