FIGURE 2.
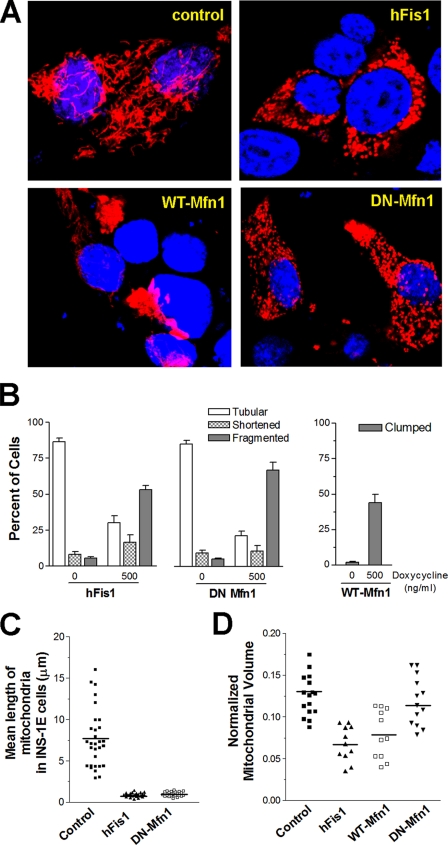
Mitochondrial morphology in INS-1E cells overexpressing fission/fusion genes. INS-1E cells were transiently transfected with mitoRFP to visualize the mitochondria. Following adenovirus infection, the fission/fusion proteins were induced by 500 ng/ml doxycycline for 48 h, and morphological changes were studied. A, representative confocal images show mitochondrial distribution and structure in cells after overexpression of hFis1, WT-Mfn1, and DN-Mfn1. B, the number of cells with tubular, shortened (rod shape), or fragmented (small round) mitochondria is expressed as the percentage of total mitoRFP-transfected cells (left and middle graph). Cells with clumped (aggregated) mitochondria were counted following induction of WT-Mfn1 (right graph). Data are presented as means ± S.E. (n = 6, for each experiment, more than 200 cells were counted). Mitochondrial volume normalized to cytosol was calculated from deconvoluted z-stack confocal images (see supplemental Fig. S4). Mean mitochondrial length (C) and mitochondrial volume (D) were compared between cells expressing different transgenes.

