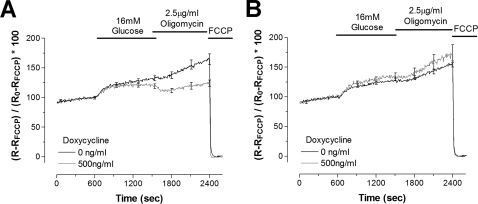
FIGURE 4.
Effects of overexpression of fission genes on mitochondrial membrane potential. After infection with adenoviruses coding for hFis1 (A) or DN-Mfn1 (B), INS-1E cells were cultured and loaded with JC-1 (500 nm) as described under “Experimental Procedures.” The mitochondrial membrane potential (Ψm) was measured at 37 °C. Changes in a fluorescence ratio of red (excitation 540 nm/emission 590 nm) over green (490 nm/540 nm) were normalized to the ratio difference between resting (100%) and FCCP-induced depolarization (0%) and expressed as the percentage of change ((R - RFCCP)/(R0 - RFCCP) × 100). Averaged results (eight traces for each condition) from non-induced (black line) and cells overexpressing (gray line) hFis1 (A) and DN-Mfn1 (B) are shown including error bars every 300 s (S.E.; n = 8).

