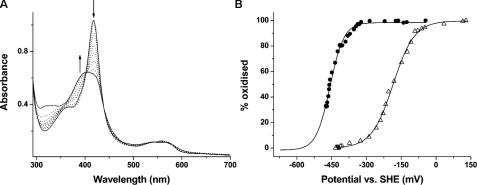
FIGURE 5.
Redox potential analysis of CYP121 mutants R386L and P346L. A, selected spectra from the potentiometric titration of CYP121 R386L mutant (9.3 μm) are shown. The most intense spectrum (solid line; Soret at 418 nm) is that for the oxidized (ferric) enzyme. Successive spectra shown as dotted lines were taken at regular intervals during the redox titration. The spectrum for the reduced (ferrous) enzyme is also shown as a solid line, exhibiting a broad Soret absorption band centered at ∼407 nm. The arrows indicate the direction of absorption change occurring during the reductive phase of the titration in regions of the spectrum at which major absorption changes occur. B, overlaid fits of absorption versus applied potential for the R386L mutant (open triangles) and for the P346L mutant (closed circles). Data were fitted using the Nernst function, as described under “Experimental Procedures” and in the supplemental material. Midpoint reduction potential values were -189 ± 5 mV and -458 ± 7 mV(versus standard hydrogen electrode), respectively.

