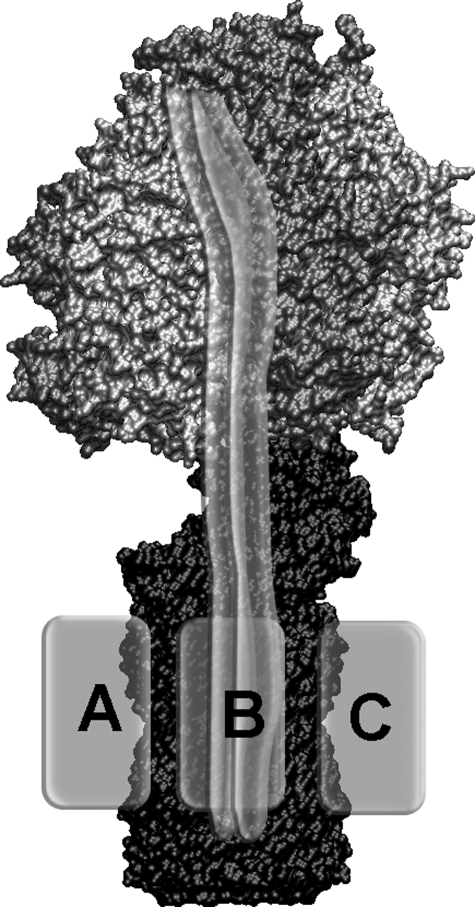
FIGURE 1.
Model of F0F1-ATP synthase. Rotating subunits γ, ε, and c10 are colored in black. The static subunits of F1, α3β3δ, are shown in gray. The b subunit dimer is shown as semitransparent gray double tubes, and the possible positions for the membrane-embedded subunit a are shown as a light gray boxes positioned according to cross-linking and stable subcomplex data, that is attached either to the left (gray box labeled A) of the b subunits, between the two b subunits (position B) and the ring of c subunits, or to the right (position C) of b2.

