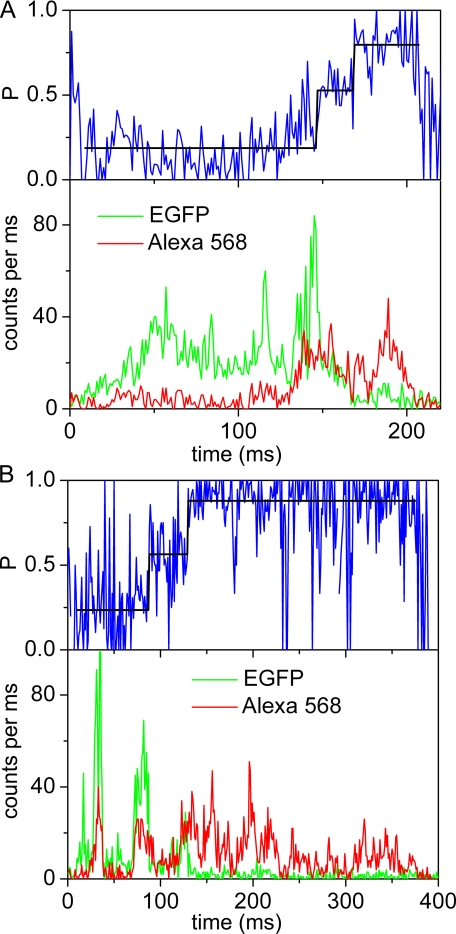
FIGURE 2.
Photon bursts of single FRET-labeled F0F1-ATP synthases upon ATP hydrolysis. Lower panels show fluorescence intensities of FRET donor EGFP fused to subunit a (green trace) and FRET acceptor Alexa568 (red trace) bound to ε56. Upper panels show the calculated proximity factor P (blue trace) with 1-ms time resolution and the mean P value for each assigned FRET level (black line). A, single photon burst recorded with continuous wave excitation at 488 nm. The FRET level transition sequence is L → M → H. B, single photon burst recorded with pulsed excitation at 488 nm. The FRET donor (EGFP) fluorescence lifetimes for the three FRET levels are τ = 2.22 ns (L), τ = 1.87 ns (M), and τ = 0.56 ns (H).

